Generic selectors
Exact matches only
Search in title
Search in content
Post Type Selectors

Popular stocks

Crypto

CFD

Currencies

Support

Gold

GBP/USD – Technical Analysis – 4h

February 27, 2026 13:04

Quick Summary

The GBP/USD chart reveals a bearish sentiment, driven by significant technical indicators. Recent trends and patterns suggest potential further downside movement.

Key resistance and support levels are crucial to monitor for confirming the directional bias.

Candlestick Analysis

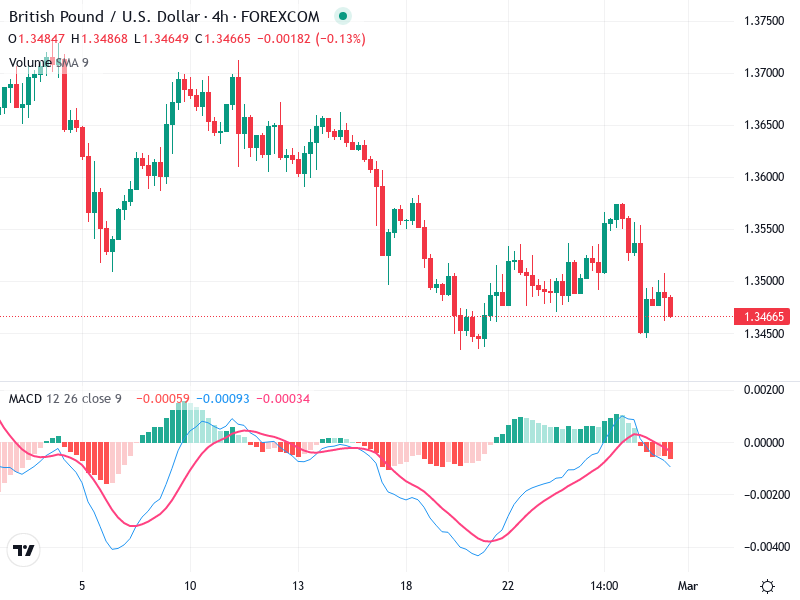
The chart reveals several bearish patterns, with no clear bullish reversal signals at the current level.

A recent bearish engulfing pattern indicates potential further downside.

The trend appears bearish, with lower highs and lower lows forming consistently.

A pullback zone around 1.3500 was recently tested and rejected, reinforcing this resistance level.

MACD Analysis

There has been a recent bearish crossover, suggesting weakening momentum.

Histogram is in negative territory, confirming bearish momentum. The shrinking histogram bars hint at slowing momentum, which might suggest a potential consolidation.

Currently, there are no strong divergences between MACD and price action, confirming the downward trend.

Volume Analysis

Volume does not show significant spikes that would confirm strong institutional activity.

Recent price declines were accompanied by moderate volume, supporting the downtrend but not strongly so.

No unusual spikes detected, indicating a lack of strong conviction behind current movements.

Support & Resistance

Strong support is identified near 1.3450. A break below this level could lead to further declines.

Resistance is visible around 1.3550, where previous pullbacks have failed.

Actionable Insights

Short-term traders might consider waiting for confirmation of a break below the 1.3450 support for a potential short entry.

Long-term investors should remain cautious and possibly look for more concrete bullish signals before entering a long position.

Observing the 1.3450 support for strength or collapse is crucial. Watch for a decrease in volume with price drops as a potential reversal signal.

The AI Technical Analysis Center is an informational tool only and does not constitute investment or trading advice.
This site is registered on wpml.org as a development site. Switch to a production site key to remove this banner.