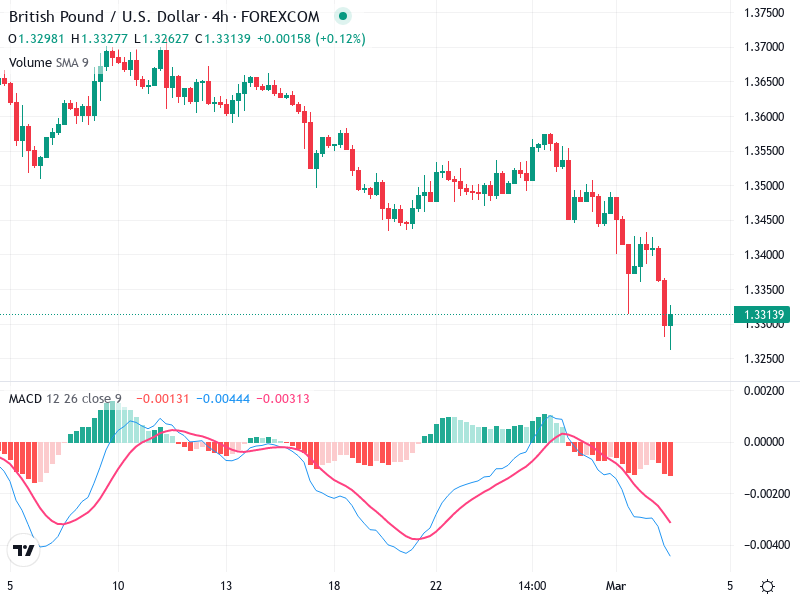
The GBP/USD chart reveals a fascinating interplay between bullish and bearish trends. The asset has recently formed notable patterns, suggesting potential reversals. Investors should closely watch for trend shifts based on recent price movements and momentum indicators.
Candlestick Analysis
The series of bearish candles highlights the prevailing downtrend.
The latest candle pattern indicates a potential short-term bullish reversal.
A significant breakout zone around 1.3320 is key, with potential for short-term bullish pullback.
MACD Analysis
The MACD line positions below the Signal line, indicating bearish momentum.
The convergence of these lines hints at a potential bullish crossover.
No evident divergences between MACD and current price actions are noted.
Volume Analysis
Volume slightly increases during price drops, signifying bearish momentum.
This modest volume rise during declines suggests sustained selling pressure.
No unusual volume spikes denote institutional activity at this time.
Support & Resistance
Support observed around 1.3280, with recent price bounces.
Resistance found near 1.3320-1.3330, critical for potential reversals.
A break of these levels could lead to significant price movements.
Actionable Insights
Consider buying if the price stays above 1.3320, backed by reversal signals.
A break under 1.3280 might signal further downside opportunity.
Exercise caution and await confirmation of direction given reversal signals.
The AI Technical Analysis Center is an informational tool only and does not constitute investment or trading advice.