Generic selectors
Exact matches only
Search in title
Search in content
Post Type Selectors

Popular stocks

Crypto

CFD

Currencies

Support

Gold

GBP/USD – Technical Analysis – 4h

March 4, 2026 13:04

Quick Summary

The GBP/USD 4-hour chart shows indications of a potential trend shift. A recent bullish engulfing pattern suggests a reversal could be on the horizon. Key resistance levels and volume changes will be crucial in confirming this transition.

Candlestick Analysis

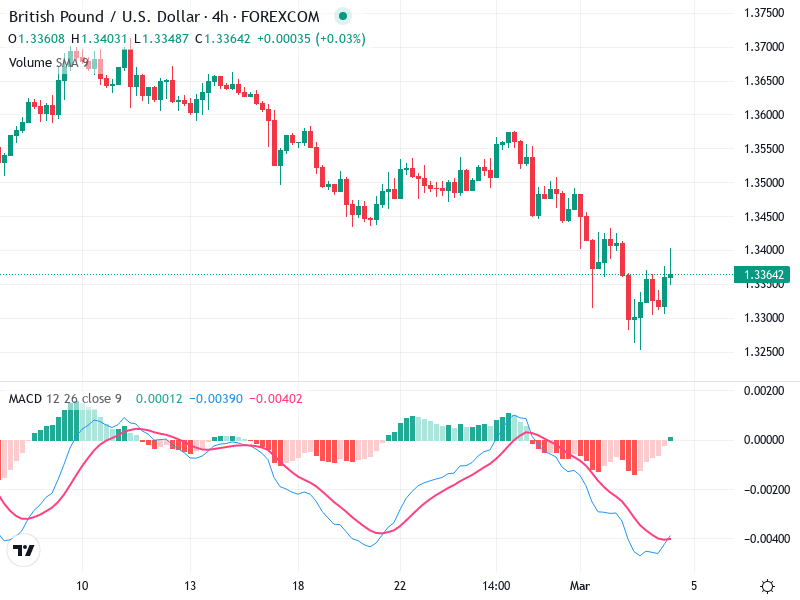
Recently, there appears to be a formation resembling a bullish engulfing pattern. This suggests a potential reversal of the recent downtrend.

The chart indicates a bearish trend transitioning into a potential sideways movement or reversal, based on recent buying pressure.

The resistance level around 1.34000 is crucial for a breakout, while support around 1.33000 could confirm a pullback.

MACD Analysis

The MACD line (blue) has crossed above the Signal line (red), indicating a potential bullish crossover, which may signify the beginning of upward momentum.

The histogram shows decreasing negative momentum, supporting the bullish crossover and suggesting diminishing selling pressure.

No significant divergence is observed between MACD and price action at this time.

Volume Analysis

There has been a noticeable increase in volume during the latest price uptick, indicating strong buying interest and potential institutional activity.

The recent price increase alongside volume suggests genuine bullish interest rather than a false breakout.

Support & Resistance

1.33000 serves as a significant support zone, previously tested and held.

1.34000 is the next resistance level to watch for a breakout, which would confirm upward momentum.

Actionable Insights

Traders might consider a buy strategy if price sustains above 1.34000 with continued volume support, signaling a confirmed bullish reversal.

A decline below 1.33000 would negate the short-term bullish outlook and potentially resume the bearish trend.

The sentiment appears cautiously bullish, pending confirmation from a break above the resistance level.

The AI Technical Analysis Center is an informational tool only and does not constitute investment or trading advice.
This site is registered on wpml.org as a development site. Switch to a production site key to remove this banner.