Generic selectors
Exact matches only
Search in title
Search in content
Post Type Selectors

Popular stocks

Crypto

CFD

Currencies

Support

Gold

GBP/USD – Technical Analysis – 4h

March 5, 2026 13:04

Quick Summary

The GBP/USD pair is exhibiting some signs of consolidation after a recent downtrend. Currently, it hovers around key support and resistance levels, indicating potential changes on the horizon.

Analyzing the chart patterns, traders should be prepared for possible trend reversals or continuations depending on upcoming price action and volume confirmations.

Candlestick Analysis

The GBP/USD price chart suggests a bearish trend with identifiable lower highs and lows.

There are notable candlestick patterns, such as hammers and doji formations, indicating potential reversals or indecision in the market.

Key zones to monitor include a resistance at 1.3400 and support at 1.3300.

MACD Analysis

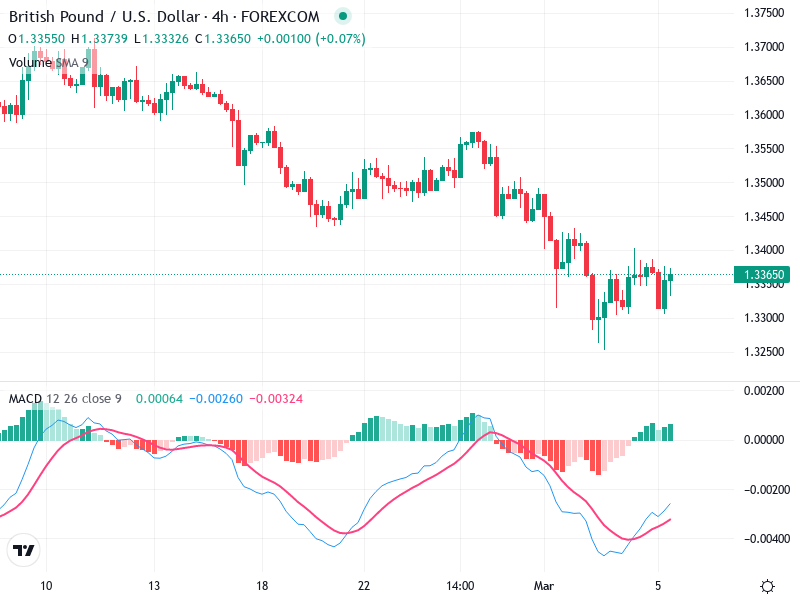
MACD line remains below the Signal line, pointing to continued bearish momentum.

The MACD histogram shows slight positivity, a possible early signal of momentum change.

Despite no clear divergences, the MACD lines indicate a potential weakening of bearish strength if the histogram strengthens without a corresponding MACD drop.

Volume Analysis

Current volume is moderate, with no drastic changes accompanying recent price movements.

The volume trend does not strongly confirm or contradict recent price trends, leaving room for interpretation.

Watch for volume spikes, which could indicate significant market interest or institutional involvement.

Support & Resistance

Support currently stands around the 1.3300 level, where recent bounces occurred.

The 1.3400 level presents immediate resistance; a breach might suggest a bullish reversal.

Volume-backed breakthroughs of these levels will be critical for confirming future price movements.

Actionable Insights

Consider buying if a bullish MACD crossover occurs near the 1.3400 resistance with a corresponding volume surge.

Potential sell opportunities arise if price actions indicate resistance holding firm and MACD continues to reinforce bearish signals.

The current market consolidation suggests caution, watching for definitive signals before proceeding with trades.

The AI Technical Analysis Center is an informational tool only and does not constitute investment or trading advice.
This site is registered on wpml.org as a development site. Switch to a production site key to remove this banner.