Generic selectors
Exact matches only
Search in title
Search in content
Post Type Selectors

Popular stocks

Crypto

CFD

Currencies

Support

Gold

GBP/USD – Technical Analysis – 4h

March 9, 2026 13:04

Quick Summary

The asset’s chart illustrates a predominantly bearish trend with recent signs of consolidation. The price is navigating key resistance and support levels which will guide future movements.

The asset is currently experiencing sideways movement, indicating indecision among traders and the possibility for future breakout or breakdown.

Candlestick Analysis

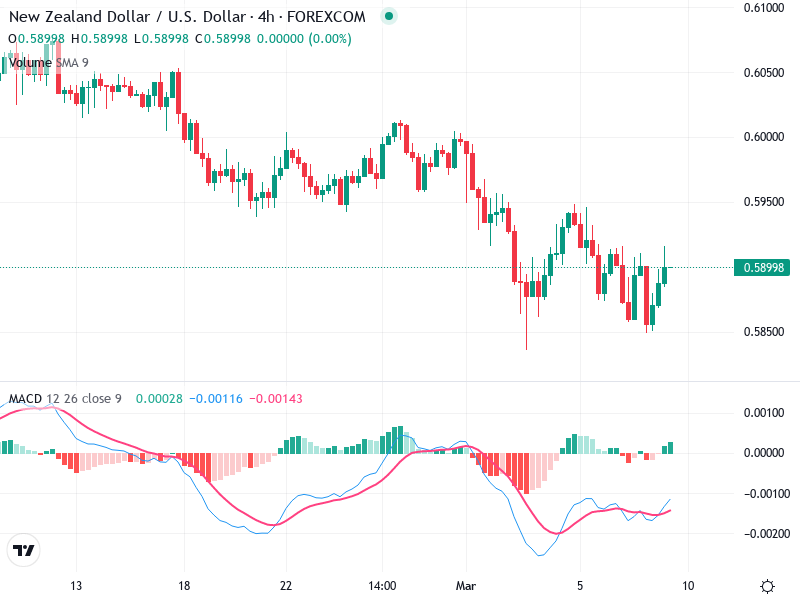
The chart shows a predominantly bearish trend, evidenced by a series of lower highs and lower lows. However, there is a recent shift to sideways movement, indicating consolidation.

There is a presence of doji and small-bodied candles recently, suggesting indecision in the market. This can often precede reversals or continuation patterns depending on the trend.

The price has attempted to break above the recent resistance around 1.3400 but pulled back, signifying selling pressure at higher levels. Support appears around the 1.3300 level.

MACD Analysis

The MACD line is attempting to cross above the Signal line, indicating a potential bullish crossover. However, it's yet to be confirmed.

The MACD histogram shows decreasing negative momentum, suggesting the bearish pressure might be weakening.

There is no clear divergence between the MACD and price action, yet the diminishing negative histogram bars imply a potential momentum shift.

Volume Analysis

Recent volume spikes correspond to price attempts at breaking key levels, indicating active participation at these junctures.

The sideways movement has relatively lower volume, typical in consolidation phases, awaiting a breakout for direction.

No unusual volume spikes suggest limited institutional intervention at present.

Support & Resistance

Resistance: Around 1.3400 - this level has rejected previous upward moves, serving as a strong selling zone.

Support: Around 1.3300 - this level has been tested multiple times, holding as a firm buying area.

The asset is testing these pivotal levels, which will determine the next significant price movements.

Actionable Insights

Consider buying if there is a confirmed bullish crossover on the MACD with increased volume and a candle close above 1.3400, confirming a breakout.

Watch for bearish signals or break below 1.3300 support with volume to consider selling, as this would confirm bearish continuation.

Until confirmed breakout or breakdown occurs, holding might be prudent as indecision prevails.

The AI Technical Analysis Center is an informational tool only and does not constitute investment or trading advice.
This site is registered on wpml.org as a development site. Switch to a production site key to remove this banner.