Generic selectors
Exact matches only
Search in title
Search in content
Post Type Selectors

Popular stocks

Crypto

CFD

Currencies

Support

Gold

GBP/USD – Technical Analysis – 4h

September 11, 2025 07:08

Quick Summary

The GBP/USD chart displays recent price movements.

Current analysis suggests caution due to market signals.

Candlestick Analysis

The market shows a recent bullish trend with a shift to a sideways consolidation.

Previous hammer and bullish engulfing patterns indicate reversal points.

A recent doji suggests market indecision leading to the sideways trend.

MACD Analysis

The MACD line is below the signal line, indicating bearish momentum.

There was a recent bearish crossover suggesting weakening upward momentum.

No significant divergence between MACD and price action at this time.

Volume Analysis

Volume appears stable with no significant spikes, indicating a lack of strong institutional activity.

Recent price consolidation matches with consistent volume levels, supporting a slowdown in momentum.

Volume trends do not show any major changes.

Support & Resistance

Resistance at 1.3560 could prevent further upward movement unless a breakout occurs.

Support at 1.3450 is crucial for maintaining the current trend.

Key levels will dictate potential breakout or continued consolidation.

Actionable Insights

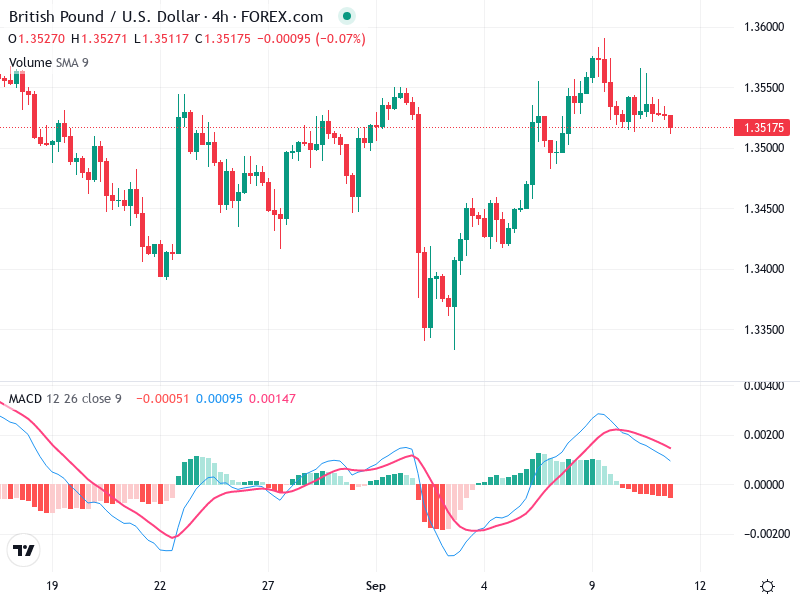
Consider buying if the price breaks significantly above 1.3560 with increased volume.

Sell if the price falls below the 1.3450 support level, especially if accompanied by rising volume.

Hold if the price remains within the current range, awaiting clearer directional signals.

The AI Technical Analysis Center is an informational tool only and does not constitute investment or trading advice.
This site is registered on wpml.org as a development site. Switch to a production site key to remove this banner.