Generic selectors
Exact matches only
Search in title
Search in content
Post Type Selectors

Popular stocks

Crypto

CFD

Currencies

Support

Gold

GBP/USD – Technical Analysis – 4h

August 25, 2025 07:07

Quick Summary

The GBP/USD 4-hour chart reveals a dynamic trading environment with evolving patterns.

Recent movements suggest potential shifts that could influence the pair’s trajectory.

Close observation of key levels is essential for anticipating future direction.

Candlestick Analysis

A potential bullish reversal pattern is observable with a strong bullish candlestick after a period of decline. This suggests a shift in sentiment.

Prior downtrend from recent highs with a sharp upward movement indicating a possible reversal or strong pullback.

The recent price action around 1.3515 suggests a breakout attempt above resistance, indicating potential bullish continuation if sustained.

MACD Analysis

A bullish crossover is evident as the MACD line crosses above the signal line, suggesting potential upward momentum.

Histogram bars are increasing in size, indicating strengthening bullish momentum.

No clear divergences are visible currently, but the alignment supports the recent bullish price action.

Volume Analysis

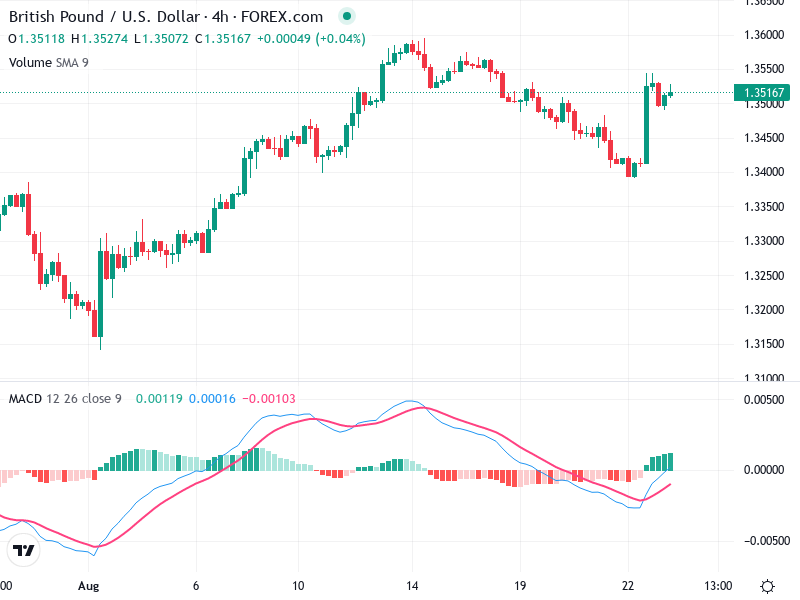
An increase in volume corresponds with the bullish price movement, suggesting strong participation in the upward move.

The increased volume supports the bullish price action, indicating credible momentum.

A noticeable volume spike aligns with the sharp price increase, potentially indicating institutional participation.

Support & Resistance

Around 1.3550 appears to be a significant resistance zone that, if broken, could confirm a new uptrend.

Key support is seen near the 1.3400 level, which acted as a base for the recent upward move.

Actionable Insights

A potential buy position could be considered if the price sustains above 1.3515 with confirmation of a breakout above 1.3550.

A close below 1.3400 could negate the bullish outlook and suggest caution.

Confirmation of the breakout above 1.3550 with continued volume support. Monitor MACD for sustained bullish crossover signals.

The AI Technical Analysis Center is an informational tool only and does not constitute investment or trading advice.
This site is registered on wpml.org as a development site. Switch to a production site key to remove this banner.