Generic selectors
Exact matches only
Search in title
Search in content
Post Type Selectors

Popular stocks

Crypto

CFD

Currencies

Support

Gold

GBP/USD – Technical Analysis – 4h

September 22, 2025 12:04

Quick Summary

The asset is currently demonstrating significant chart patterns that provide insight into potential future movements.

Recent analysis indicates key support and resistance levels that could influence price action.

Candlestick Analysis

The chart shows a recent bearish trend with a notable downtrend after a peak around early September.

There is the appearance of a potential hammer-like candlestick at the end of the chart, which could indicate a reversal if confirmed by subsequent bullish movement.

The recent price action around the 1.34500 level suggests a possible support zone where buyers might step in.

MACD Analysis

The MACD line is below the Signal line, indicating a bearish crossover, which suggests continued downward momentum.

The histogram is showing negative values but is beginning to move upwards, suggesting a potential weakening in bearish momentum.

No significant divergences are present between the MACD and the price action at this time.

Volume Analysis

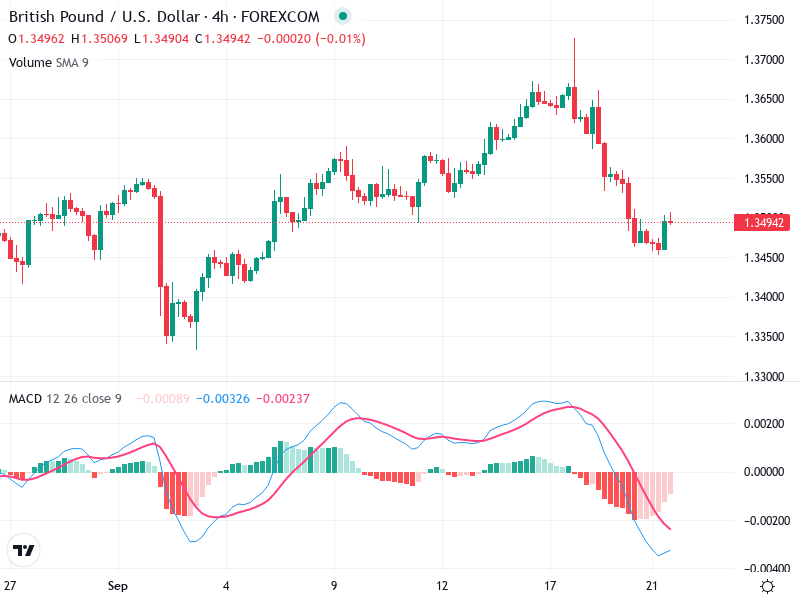
The chart does not explicitly show volume, but the presence of any changes would need to support the idea of a reversal at the identified support level.

Watch for increased volume at support, which would reinforce a potential reversal.

There are no visible volume spikes, but increased volume coinciding with price movement would be significant.

Support & Resistance

Around 1.34500, where the price has shown some consolidation and potential for reversal.

Near the recent peak around 1.37500, historically acting as a ceiling for the past moves.

Actionable Insights

Consider entering long positions if the price confirms a reversal with increased volume and bullish candlestick patterns over the support level.

Continue holding or enter short positions if the price fails to move back above the 1.34500 support level and the MACD confirms bearish dominance.

Traders might wait for clearer signals if uncertain, with particular attention to upcoming price and volume behavior.

The AI Technical Analysis Center is an informational tool only and does not constitute investment or trading advice.
This site is registered on wpml.org as a development site. Switch to a production site key to remove this banner.