Generic selectors
Exact matches only
Search in title
Search in content
Post Type Selectors

Popular stocks

Crypto

CFD

Currencies

Support

Gold

GBP/USD – Technical Analysis – 4h

September 26, 2025 12:04

Quick Summary

The analysis of the chart reveals key technical insights that can influence trading strategies. The current trend appears cautious with potential shifts in direction. Investors should pay close attention to these indicators for better decision making.

Candlestick Analysis

No distinct bullish reversal pattern is visible yet. Recent candlesticks show weakening bearish momentum, reflected by several short-bodied candles indicating indecision.

The overall trend remains bearish, evidenced by a series of lower highs and lower lows.

A pullback zone is conspicuous near the 1.3350 level, highlighting an area where the price attempted to stabilize.

MACD Analysis

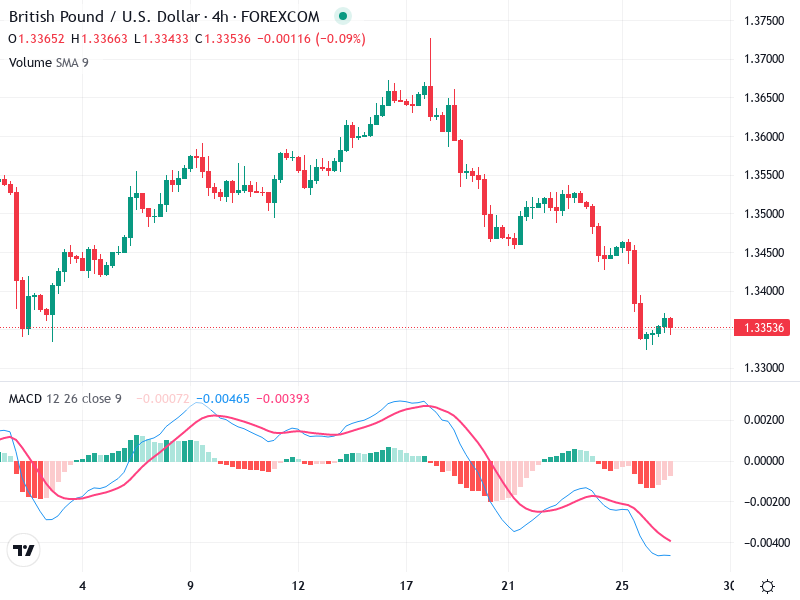
The MACD line currently sits below the Signal line, reflecting a bearish sentiment. Notably, the lines are converging, hinting at a potential crossover.

The histogram reveals a decreasing bearish momentum, marked by diminishing bars that indicate the potential weakening of the downtrend.

No clear divergence is noticeable between MACD and price action at the moment.

Volume Analysis

Volume spikes are observed on large red candles, which suggest significant selling pressure.

A decrease in volume coupled with narrowing candles indicates a reduction in selling pressure.

No significant volume anomalies signal institutional activity at this time.

Support & Resistance

Support is evident near the 1.3300 level, where the price recently attempted stabilization.

Resistance is identified around the 1.3400 level, consistent with a recent high during the pullback.

Breaking below support may trigger further bearish action, whereas a break above resistance might suggest a trend reversal.

Actionable Insights

Consider sell positions if the price breaks below 1.3300 with confirming volume.

Wait for a bullish crossover in MACD and break above 1.3400 before contemplating long positions.

Maintain short positions while monitoring for a break in current support or MACD crossover as exit signals.

The AI Technical Analysis Center is an informational tool only and does not constitute investment or trading advice.
This site is registered on wpml.org as a development site. Switch to a production site key to remove this banner.