Generic selectors
Exact matches only
Search in title
Search in content
Post Type Selectors

Popular stocks

Crypto

CFD

Currencies

Support

Gold

GBP/USD – Technical Analysis – 4h

August 26, 2025 07:08

Quick Summary

The chart highlights a significant transition from a recent bullish recovery to a dominant bearish trend. In the latter phase, the chart clearly illustrates a downward trajectory. This shift indicates potential opportunities for traders depending on market developments.

Key levels of support and resistance, along with volume trends, further enhance the understanding of the current market dynamics.

Candlestick Analysis

The overall trend reflects a bearish sentiment following a strong bullish recovery. The price action suggests a shift towards downside movement.

Significant patterns, such as the bearish engulfing near the peak, hint at a reversal followed by a decline, indicating caution for bullish traders.

Breakout zones around 1.3550 have been identified, acting as both resistance and pivot points for recent pullbacks.

MACD Analysis

The MACD line is currently below the Signal line, which shows a bearish crossover and reinforces the bearish outlook on the chart.

The histogram's proximity to the zero line indicates a weakening in bearish momentum, yet it aligns with the broader downward trend.

No significant divergences are observed, suggesting the MACD is in alignment with the current price action.

Volume Analysis

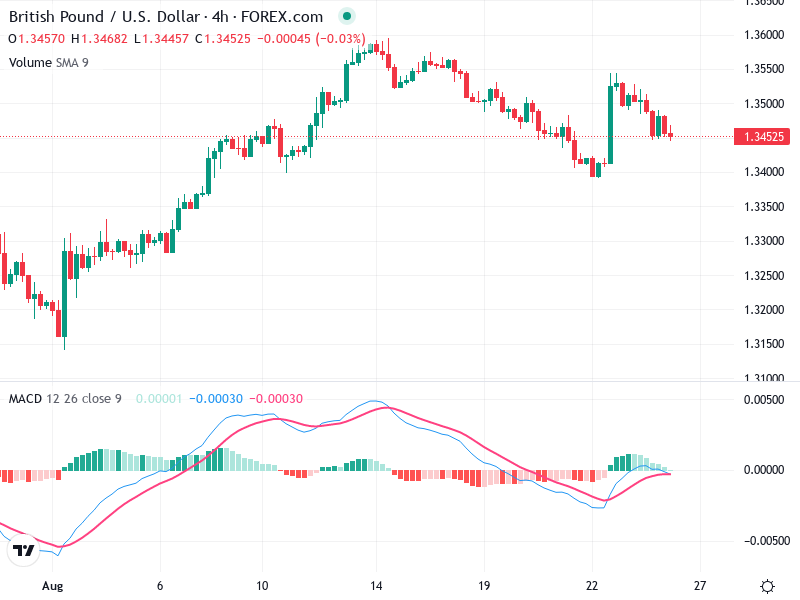
Volume trends reveal occasional spikes tied to key market activities, highlighting periods of high trading activity and potential reversals.

During the preceding uptrend, moderate volume was observed, but a declining pattern is accompanied by low volume, which hints at weak bearish pressure.

An interesting spike in volume during a recent price surge suggests potential institutional trading or reaction to significant news.

Support & Resistance

The resistance at 1.3550 is notably strong, serving as a point where the price met rejection, preventing further upward movement.

Support is firmly established around the 1.3400 level, marking where previous downtrends were stalled.

Breaching these levels with significant volume will be crucial in determining future price directions and market trends.

Actionable Insights

For a sell strategy, short positions can be considered if the price fails to break through the 1.3550 resistance with volume confirmation.

A potential buy strategy involves watching for bullish reversals around the 1.3400 support, especially with increased trading volume.

If prices remain between 1.3550 and 1.3400 with low volume, holding positions may be advisable for the time being.

The AI Technical Analysis Center is an informational tool only and does not constitute investment or trading advice.
This site is registered on wpml.org as a development site. Switch to a production site key to remove this banner.