Generic selectors
Exact matches only
Search in title
Search in content
Post Type Selectors

Popular stocks

Crypto

CFD

Currencies

Support

Gold

GBP/USD – Technical Analysis – 4h

October 6, 2025 12:04

Quick Summary

The chart of the British Pound/U.S. Dollar ( GBP/USD ) demonstrates key movements in the forex market. Recently, it showcases some bearish trends with occasional bullish corrections. Key resistance and support levels are easily identifiable, providing insight into potential trading strategies.

Candlestick Analysis

The chart shows a general bearish trend with intermittent bullish corrections.

A recent bullish engulfing pattern can be seen, indicating a potential short-term reversal.

Presence of doji candles suggests indecision in the market around current levels. The pullback after a strong bearish rally confirms a resistance zone around 1.3550.

MACD Analysis

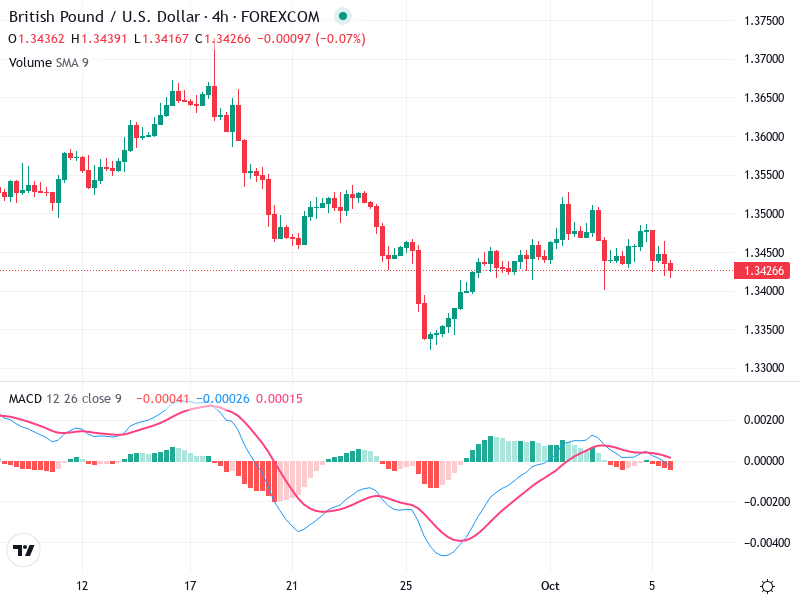
The MACD line is converging towards the Signal line, indicating potential bearish crossover, which might suggest weakening bullish momentum.

The MACD histogram shows a decrease in positive momentum, hinting at potential bearish divergence.

There is a mild bearish divergence, as price reached a similar level as before, but MACD shows lower highs.

Volume Analysis

Volume remains relatively stable, with a slight increase during bearish movements, supporting the price declines.

No prominent spikes suggest lack of significant institutional action at current levels.

Stability in volume aligns with the bearish trend observed in price movements.

Support & Resistance

Around 1.3550 is a key resistance level where price has reversed previously.

Around 1.3400 acts as strong support, a level where buyers stepped in previously.

Key levels of support and resistance are well-defined, guiding potential trading decisions.

Actionable Insights

Given the bearish momentum, traders might consider short positions below 1.3400 if the price breaches this support decisively.

Look for a bearish crossover in MACD or increased volume during bearish moves as a confirmation signal.

Reversal signals like bullish engulfing in lower time frames could present risks to short positions.

The AI Technical Analysis Center is an informational tool only and does not constitute investment or trading advice.
This site is registered on wpml.org as a development site. Switch to a production site key to remove this banner.