Generic selectors
Exact matches only
Search in title
Search in content
Post Type Selectors

Popular stocks

Crypto

CFD

Currencies

Support

Gold

GBP/USD – Technical Analysis – 4h

October 7, 2025 12:04

Quick Summary

The GBP/USD chart indicates a bearish trend in the 4-hour time frame.

The asset has shown a resumption of bearish pressure after a brief recovery phase.

Attention to key levels such as 1.3400 for breakdown potential is crucial.

Candlestick Analysis

No major single candlestick patterns like a hammer or doji are evident.

There is a general formation suggesting bearish pressure with a recent red candlestick indicating potential continuation.

The price has pulled back to the 1.3400 level, which could act as a psychological support-turned-resistance zone.

MACD Analysis

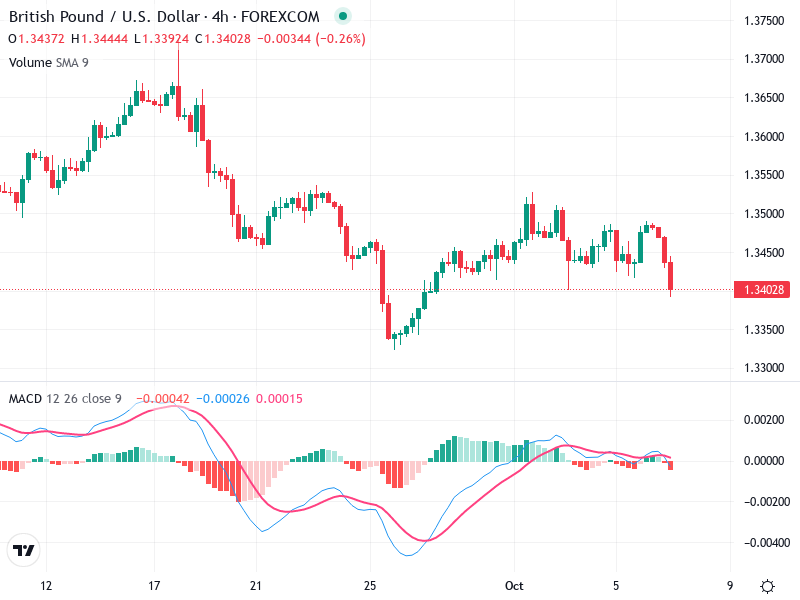
The MACD line is below the Signal line, indicating a bearish crossover recently occurred, suggesting increasing bearish momentum.

The MACD histogram shows a shift from positive to negative, reinforcing the bearish momentum.

No significant divergence observed between the MACD and price action, indicating alignment with current price movement.

Volume Analysis

Volume appears steady without any significant spikes.

The recent bearish candlestick aligns with moderate volume, supporting the downward move.

Low volume indicates a lack of strong conviction in either direction, suggesting traders should be cautious of potential false breakouts.

Support & Resistance

The 1.3400 level is a crucial support based on recent candlestick closes and could be pivotal for future price movements.

Resistance is near the 1.3550 level, where previous attempts to rally were halted.

Actionable Insights

If price breaks and sustains below 1.3400 with increased volume, short positions could be considered with a target towards lower support at 1.3350.

Waiting for clearer signals or volume confirmation could be prudent due to the lack of strong movements.

Watch for price behavior around the 1.3400 level and any emerging candlestick patterns or volume changes as a sign of potential reversal or continuation.

The AI Technical Analysis Center is an informational tool only and does not constitute investment or trading advice.
This site is registered on wpml.org as a development site. Switch to a production site key to remove this banner.