Generic selectors
Exact matches only
Search in title
Search in content
Post Type Selectors

Popular stocks

Crypto

CFD

Currencies

Support

Gold

GBP/USD – Technical Analysis – 4h

October 14, 2025 12:04

Quick Summary

The British Pound versus U.S. Dollar chart displays a notable bearish momentum. The 4-hour chart reveals crucial levels, offering insights into potential price movements. Traders should note both supporting and resisting turns in the market dynamics.

Candlestick Analysis

The chart shows a prevailing bearish trend, characterized by a series of lower highs and lower lows.

Recently, the appearance of several bearish candles indicates strong selling pressure. There are no significant reversal patterns like bullish engulfing or hammer at the current support level.

The chart appears to be approaching a recent low around 1.3260, suggesting a potential pullback if buyers intervene.

MACD Analysis

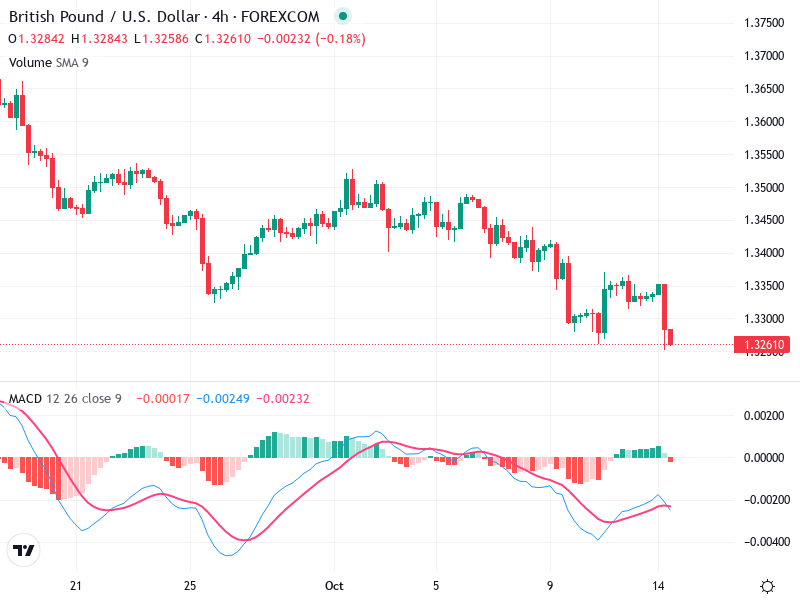
There is a bearish crossover, where the MACD line crosses below the Signal line, reinforcing a downward momentum.

The MACD histogram is slightly negative, indicating decreasing momentum. This suggests a continuation of the bearish trend if it doesn't shift upwards soon.

Currently, there is no significant divergence between the MACD and price action, supporting the downward price movement.

Volume Analysis

Volume spikes align with the larger bearish movements, suggesting strong participation in selling, possibly from institutional traders.

The recent increase in volume on down moves supports the bearish sentiment, as high volume on declines often indicates strong seller conviction.

Overall, volume trends illustrate a significant seller presence, maintaining pressure on current price levels.

Support & Resistance

The key support level is around 1.3260. If this level holds, a short-term reversal might occur.

Immediate resistance is around 1.3350, where the price last consolidated before resuming its fall. This will be crucial for any potential upside movements.

Evaluating these levels is essential for tracking any future price action peaks and valleys.

Actionable Insights

Consider selling if the price breaks below 1.3260 with confirming momentum on volume and MACD.

Watch for a move above 1.3350 with increased volume can signal a potential reversal; consider buying if confirmed by a bullish MACD crossover.

Be cautious of false breakouts around the support level as these could trigger short-term value buying.

The AI Technical Analysis Center is an informational tool only and does not constitute investment or trading advice.
This site is registered on wpml.org as a development site. Switch to a production site key to remove this banner.