Generic selectors
Exact matches only
Search in title
Search in content
Post Type Selectors

Popular stocks

Crypto

CFD

Currencies

Support

Gold

GBP/USD – Technical Analysis – 4h

October 20, 2025 12:04

Quick Summary

The GBP/USD 4-hour chart indicates significant consolidation around key levels with minor volume spikes during corrections, potentially indicating upcoming breakouts.

The absence of clear candlestick patterns coupled with weakening MACD signals suggests a cautious approach.

Candlestick Analysis

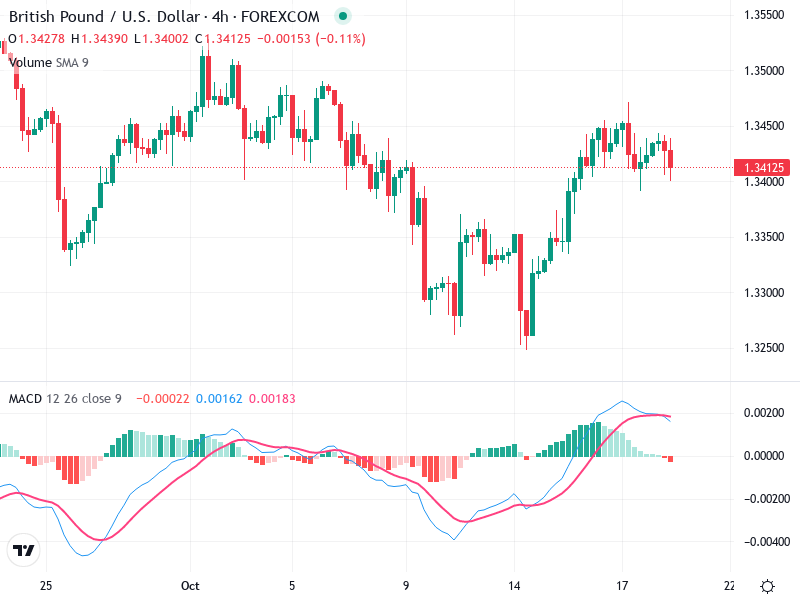
No prominent single candlestick pattern is immediately obvious. However, earlier in October, there is a noticeable bullish engulfing pattern following a downtrend, which indicated a potential reversal.

The trend appears sideways with minor fluctuations highlighting no strong directional bias currently.

Around 1.3420, there seems to be a consolidation area where price repeatedly tests but struggles to break decisively.

MACD Analysis

The MACD line is slightly above the Signal line, indicating weak bullish momentum.

The recent bearish convergence suggests a potential shift towards bearish sentiment.

The histogram is showing decreasing bullish momentum, nearing the zero line, which can suggest weakening in the current trend.

Volume Analysis

Volume generally spikes during minor corrective moves, suggesting potential institutional interest during these periods.

The decrease in volume with price consolidation suggests lack of strong conviction in the current trend possibly leading to a breakout soon.

Previous unusual volume spikes around early October coincided with large price movements, hinting at significant activity.

Support & Resistance

Support: 1.3300 is identified as key support after sharp declines, witnessing repeated tests.

Resistance: 1.3450 acts as recent resistance, where price struggles to maintain any breakthrough.

These levels are crucial for determining entry and exit points, as breaking either could lead to significant moves.

Actionable Insights

Consider a buy if the price breaks and holds above 1.3450 with increased volume.

A break below 1.3300 with volume confirmation could signal a selling opportunity.

Current sideways movement suggests a wait-and-see approach until clearer signals appear.

The AI Technical Analysis Center is an informational tool only and does not constitute investment or trading advice.
This site is registered on wpml.org as a development site. Switch to a production site key to remove this banner.