Generic selectors
Exact matches only
Search in title
Search in content
Post Type Selectors

Popular stocks

Crypto

CFD

Currencies

Support

Gold

GBP/USD – Technical Analysis – 4h

August 27, 2025 07:08

Quick Summary

The chart displays significant bearish sentiment following a mid-month peak. Downward movements indicate a consistent decline.

Bearish engulfing patterns and potential hammer formations suggest strong selling pressure but hint at possible reversals.

Technical levels at 1.3450 reflect a pullback zone where price has tested support.

Candlestick Analysis

The chart indicates a predominantly bearish trend following the peak in the middle of the month. Significant downward movements show a consistent decline.

There are instances of bearish engulfing patterns, which suggest strong selling pressure. Recently, a potential hammer (bouncing off a support) could indicate a reversal attempt.

Around the 1.3450 level, there appears to be a pullback zone where price has tested previous support.

MACD Analysis

The MACD line is below the Signal line, indicating a bearish crossover.

The MACD histogram is showing minor bullish divergence, suggesting a possible reduction in bearish momentum.

There is a slight divergence where prices continue to show lower lows, but the MACD does not replicate these lows, hinting at potential weakening in the downtrend.

Volume Analysis

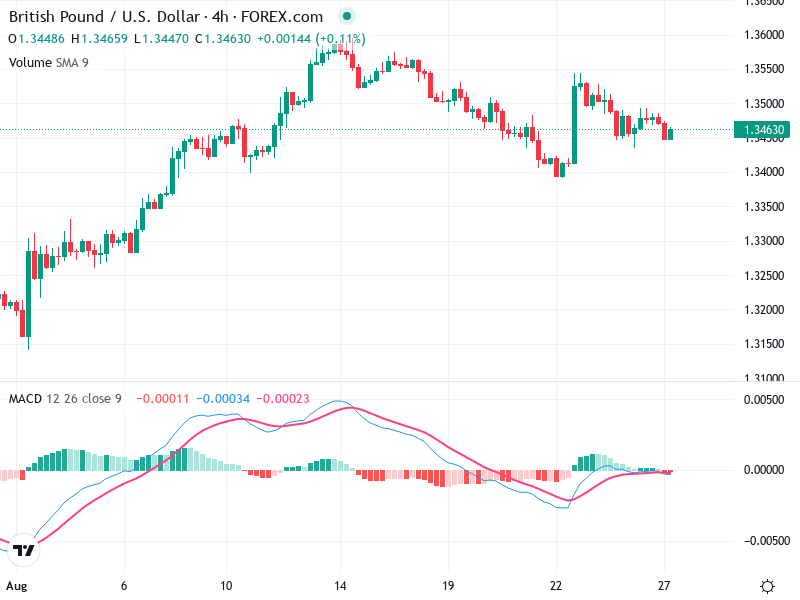
There are visible spikes in volume during the steep downward moves, confirming the selling pressure. However, during recent sessions, the volume is not exceptionally high, suggesting less conviction in the ongoing trend.

Institutional Activity: There doesn’t appear to be unusual volume activity that would strongly suggest institutional intervention.

The overall volume analysis does not strongly imply institutional activity.

Support & Resistance

Key support exists around 1.3400, which has held on multiple occasions.

Near-term resistance appears at 1.3550, where price attempts to rise have previously faltered.

These levels denote significant support and resistance, critical for the future trend.

Actionable Insights

For risk-tolerant traders, looking to buy near the 1.3400 support with tight stop-losses may provide an opportunity if bullish confirmation arises.

A break above 1.3550 resistance with strong volume could indicate a shift to bullish sentiment, while a further decline below 1.3400 could suggest continuation of the downtrend.

The current sentiment favors bearishness, but with weakening momentum; watching economic factors is essential.

The AI Technical Analysis Center is an informational tool only and does not constitute investment or trading advice.
This site is registered on wpml.org as a development site. Switch to a production site key to remove this banner.