Generic selectors
Exact matches only
Search in title
Search in content
Post Type Selectors

Popular stocks

Crypto

CFD

Currencies

Support

Gold

GBP/USD – Technical Analysis – 4h

October 21, 2025 12:04

Quick Summary

The British Pound/U.S. Dollar chart reflects current market conditions. The chart illustrates a tendency toward selling pressure. Key levels of support and resistance are currently being tested.

Candlestick Analysis

The chart displays a mostly sideways trend with periods of bullish and bearish movements. The recent candles suggest a bearish inclination as they follow a series of lower highs and lower lows.

There are multiple bearish engulfing patterns visible, indicating bearish sentiment.

The presence of long wicks suggests indecision in the market, likely due to testing support and resistance levels.

MACD Analysis

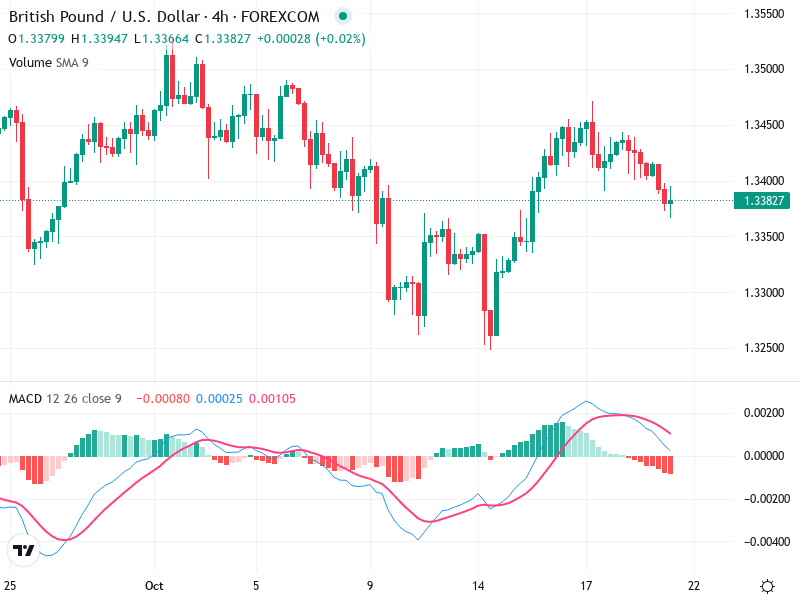
The MACD line is below the Signal line, which indicates a bearish crossover, suggesting downward momentum.

The MACD histogram has been printing negative bars, reinforcing the bearish trend. A consistent increase in the size of negative bars suggests strengthening bearish momentum.

No significant divergences between MACD and price action are evident, indicating price movements are currently supported by MACD readings.

Volume Analysis

There appears to be an increase in volume during downward movements, supporting the bearish sentiment.

A sustained increase in volume on down days is indicative of stronger selling pressure.

No significant spikes are present that suggest institutional activity, but consistent volume aligns with the observed price movements.

Support & Resistance

Key support around 1.3350, which, if broken, could lead to further declines.

Resistance level is observed near 1.3450; a break above this level might indicate a reversal or consolidation at higher levels.

The recent pullback may lead to testing the support level seen around 1.3350.

Actionable Insights

Bearish Bias: Given the bearish crossover on MACD and recent candlestick patterns, a sell strategy could be considered, particularly if the price breaks below the 1.3350 support.

Watch for further confirmation of the bearish trend such as increased negative MACD histogram or a significant drop below the support line.

Remain cautious of any reversals at the support level, as well as potential bullish signals like a bullish MACD crossover or a candlestick reversal pattern that could change the trend.

The AI Technical Analysis Center is an informational tool only and does not constitute investment or trading advice.
This site is registered on wpml.org as a development site. Switch to a production site key to remove this banner.