Generic selectors
Exact matches only
Search in title
Search in content
Post Type Selectors

Popular stocks

Crypto

CFD

Currencies

Support

Gold

GBP/USD – Technical Analysis – 4h

October 29, 2025 13:04

Quick Summary

The GBP/USD 4-hour chart is showcasing a prominent bearish trend.

Key levels are playing a crucial role as the pair navigates through significant support and resistance zones.

Candlestick Analysis

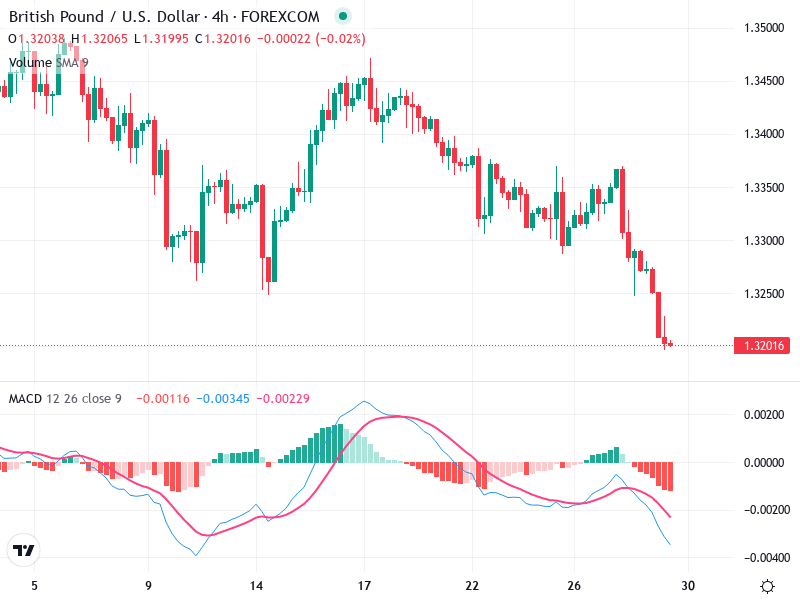
The overall trend is bearish, as seen by a series of lower highs and lower lows.

Recently, there's a bearish continuation with long red candles, indicating strong selling pressure.

The support level around 1.3200 has been breached, suggesting a potential further downside if not quickly reclaimed.

MACD Analysis

The MACD line is below the Signal line, reinforcing the bearish momentum with a recent bearish crossover.

The MACD histogram shows increasing negative bars, which indicates strengthening downward momentum.

No clear divergences are observed, which suggests the price action and momentum are in sync.

Volume Analysis

There is a noticeable increase in volume accompanying the recent downward move, suggesting strong conviction in the selling pressure.

The spikes in volume could imply institutional activity, further consolidating the bearish tendency.

Significant volume surges are aligning with the prevailing bearish sentiment in the market.

Support & Resistance

Immediate support is now around the 1.3200 level, which, if consistently broken, can pave the way for further declines.

The recent highs around 1.3370 mark a potential resistance area if a retracement occurs.

Monitoring these levels can provide critical insights into potential market reversals or continuations.

Actionable Insights

Consider selling opportunities on retracements towards the 1.3200 level, now an overhead resistance.

For those already in short positions, maintaining the position could be beneficial if the bearish momentum continues.

Monitor for any bullish reversal patterns or consolidation near current levels, which might indicate a potential shift.

The AI Technical Analysis Center is an informational tool only and does not constitute investment or trading advice.
This site is registered on wpml.org as a development site. Switch to a production site key to remove this banner.