Generic selectors
Exact matches only
Search in title
Search in content
Post Type Selectors

Popular stocks

Crypto

CFD

Currencies

Support

Gold

GBP/USD – Technical Analysis – 4h

October 31, 2025 13:04

Quick Summary

The 4-hour chart of GBP/USD displays a notable bearish outlook, underpinned by lower highs and lows.

Key levels around 1.3100 and 1.3250 are critical for understanding market dynamics.

Candlestick Analysis

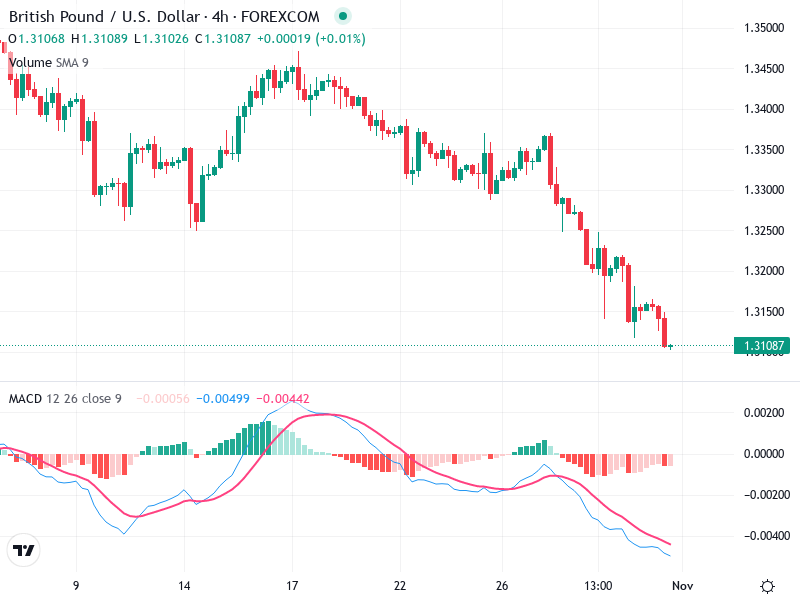
The chart shows a clear bearish trend, indicated by a series of lower highs and lower lows.

Long red candlesticks suggest strong selling pressure, with a small doji recently forming to indicate potential indecision.

The price approaches a support area near 1.3100, possibly leading to a pullback if buyers show interest.

MACD Analysis

The MACD line remains under the Signal line, reinforcing bearish momentum.

The MACD histogram in negative territory with growing bars indicates increasing bearish sentiment.

No significant divergences appear between the MACD and price action, as both align with the bearish trend.

Volume Analysis

Volume trends show moderate but consistent support for the downtrend.

No unusual spikes indicate that institutional buying interest is lacking, with stable volumes noted amidst declines.

Support & Resistance

Support is identified around the 1.3100 level, given recent market activities.

Resistance at 1.3250 marks a prior consolidation area before further declines.

Reversals must surpass this resistance to alter the current bearish sentiment.

Actionable Insights

Short opportunities may arise on resistance retracements.

A break below 1.3100 with volume would suggest further downside potential.

Look for bullish reversal patterns near support to identify possible buying scenarios.

The AI Technical Analysis Center is an informational tool only and does not constitute investment or trading advice.
This site is registered on wpml.org as a development site.