October 31, 2025 13:02
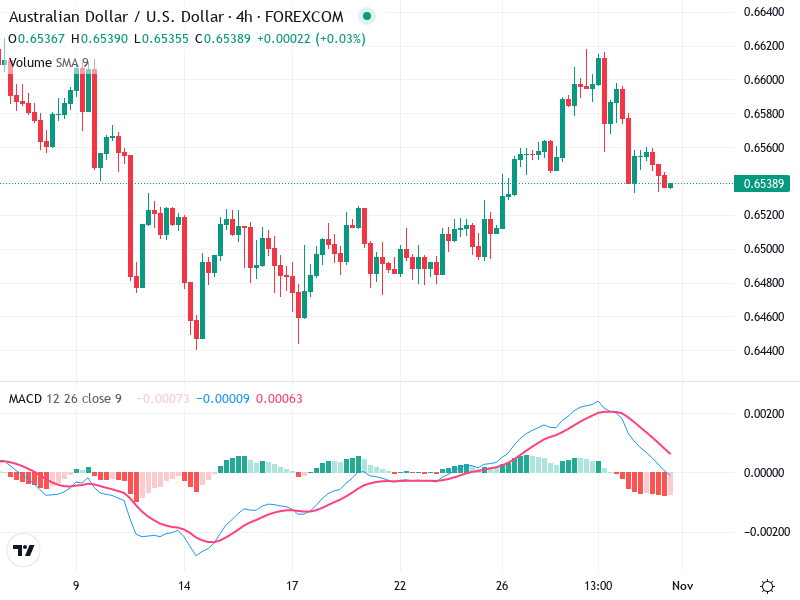
AUD/USD – Technical Analysis – 4h
The AUD/USD 4h chart exhibits a transitioning phase, evolving from a short-term bullish trend to a consolidation. Current indicators suggest a cautious approach as the…
Read more