Generic selectors
Exact matches only
Search in title
Search in content
Post Type Selectors

Popular stocks

Crypto

CFD

Currencies

Support

Gold

GBP/USD – Technical Analysis – 4h

November 3, 2025 13:04

Quick Summary

The technical analysis indicates a predominantly bearish trend while showcasing potential consolidation phases. The asset’s price action suggests indecision among traders. Recent patterns and signals hint at possible reversal signs.

Candlestick Analysis

The chart shows a predominantly bearish trend as the price has been consistently moving lower.

There are no prominent reversal candlestick patterns like bullish engulfing or hammer formations visible currently. The recent candles suggest a potential consolidation phase, indicating indecision in the market.

The area around 1.3150 seems to be acting as a minor support, with the price struggling to decisively break higher.

MACD Analysis

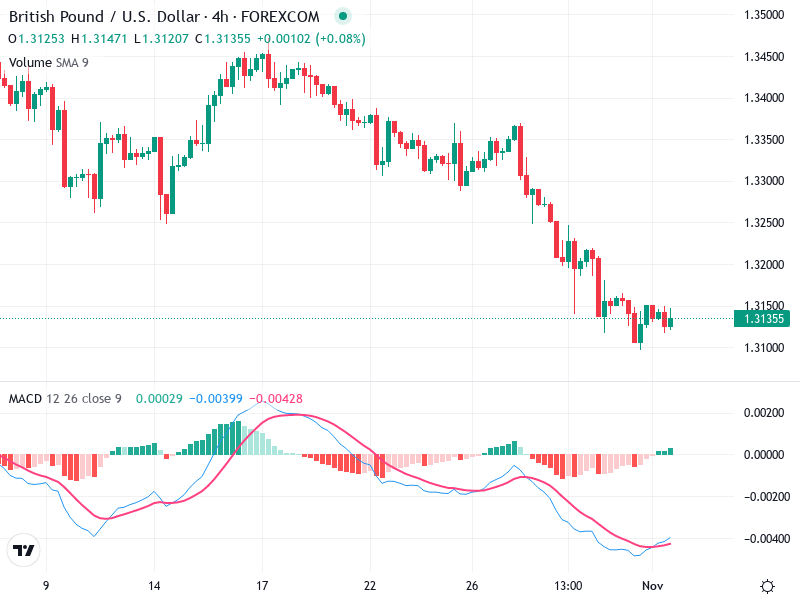
The MACD line (blue) is slightly above the signal line (red), indicating a recent bullish crossover. However, the momentum appears weak.

The histogram bars turning green and getting smaller suggest reduced bearish momentum, potentially hinting at a short-term reversal or consolidation.

No clear divergences between the MACD and price action, aligning with the prevailing bearish trend.

Volume Analysis

Volume appears to be relatively stable without any significant spikes, indicating a lack of strong buying or selling pressure.

The absence of volume spikes during recent price moves suggests a lack of conviction in the trend continuation.

The volumetric patterns do not indicate significant market participation.

Support & Resistance

Around 1.3100-1.3150 appears to be a support zone where buyers have shown some interest previously.

The 1.3200 level may act as resistance given its alignment with previous interim highs.

Monitoring these levels can provide valuable insights into potential price movements.

Actionable Insights

Traders may look for confirmation of a bullish reversal through candlestick patterns or stronger MACD momentum before considering buy positions. Conversely, if the price breaks below the support zone on high volume, further downside could be expected.

Confirmation of a reversal with stronger volume or MACD momentum is key.

A successful break above 1.3200 with volume can signal more upside potential.

The AI Technical Analysis Center is an informational tool only and does not constitute investment or trading advice.
This site is registered on wpml.org as a development site.