Generic selectors
Exact matches only
Search in title
Search in content
Post Type Selectors

Popular stocks

Crypto

CFD

Currencies

Support

Gold

GBP/USD – Technical Analysis – 4h

November 21, 2025 13:04

Quick Summary

The asset exhibits a predominantly sideways to slightly bearish trend with recent consolidation around important levels.

Price action suggests potential for reversal patterns, which should be watched closely in the coming sessions.

Overall, market sentiment is currently neutral to slightly bearish, with external factors possibly influencing future movements.

Candlestick Analysis

The chart shows a predominantly sideways to slightly bearish trend. The recent price action indicates consolidation around the 1.30800 level.

Recently, there appears to be a potential hammer pattern around the recent lows, suggesting possible support and a bullish reversal signal. However, confirmation with subsequent bullish candles is essential.

Watch for a breakout above 1.31500 or a pullback near the 1.30500 level for more substantial price moves.

MACD Analysis

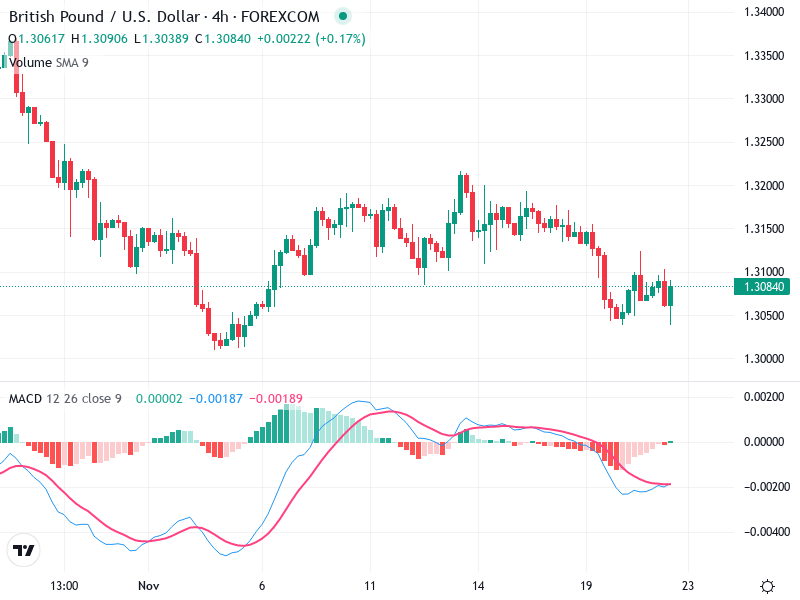
The MACD line is slightly below the Signal line, indicating a recent bearish crossover; however, the lines are converging, suggesting potential for reversal.

The MACD histogram shows diminishing bearish momentum, which could indicate a weakening downtrend and potential for a bullish turn.

No clear divergence is visible between the MACD and price action at this point.

Volume Analysis

Volume has been relatively stable with occasional spikes. These spikes align with price drops, indicating that the downward moves had robust volume support.

Larger volume spikes during price drops might suggest some institutional selling interest.

The consistency in volume trends could suggest anticipation of a break in the prevailing trend.

Support & Resistance

Key support is around the 1.30500 level, where the price has shown interest to hold and reverse.

Resistance is near 1.31500, which needs to be breached for a bullish momentum shift.

Monitoring these levels is crucial for anticipating future price action.

Actionable Insights

Consider a cautious buy if price actions show significant bullish candles above 1.31000 with increased volume.

Selling short may be ideal if the price breaks below 1.30500 with increasing volume.

Hold if the price continues to hover between 1.30500 and 1.31500 without strong directional bias.

The AI Technical Analysis Center is an informational tool only and does not constitute investment or trading advice.
This site is registered on wpml.org as a development site. Switch to a production site key to remove this banner.