Generic selectors
Exact matches only
Search in title
Search in content
Post Type Selectors

Popular stocks

Crypto

CFD

Currencies

Support

Gold

GBP/USD – Technical Analysis – 4h

November 28, 2025 13:04

Quick Summary

The GBP/USD 4-hour chart is currently exhibiting a cautiously bullish trend. Recent price action indicates a consolidation phase after an upward movement. Traders are advised to monitor key levels for potential breakouts or reversals.

This analysis highlights important candlestick patterns, MACD indications, and volume insights to provide a comprehensive view on the asset’s direction.

Candlestick Analysis

Significant bullish candles indicate a recent upward trend. A prominent bullish engulfing pattern is visible, suggesting a strong bullish signal.

The overall trend remains bullish with recent pullbacks showing consolidation at higher levels.

The price has pulled back from its high near 1.3250, acting as the immediate resistance zone.

MACD Analysis

The MACD line is slightly above the Signal line, suggesting weakening bullish momentum or potential consolidation.

The histogram shows declining strength with lower peaks, hinting at a decreasing bullish momentum.

No significant divergences noted between the MACD and price action, indicating alignment.

Volume Analysis

Volume increased during the upward move, supporting the price increase.

Recent decrease in volume during the pullback suggests temporary consolidation rather than a full reversal.

No unusual volume spikes suggestive of institutional trading are observed.

Support & Resistance

Immediate support is around 1.3150, a previous resistance point turned support after the breakout.

Next resistance level is around 1.3250 where the price has struggled to break through.

The 1.3250 resistance is crucial; a strong breakout could signal further upward momentum.

Actionable Insights

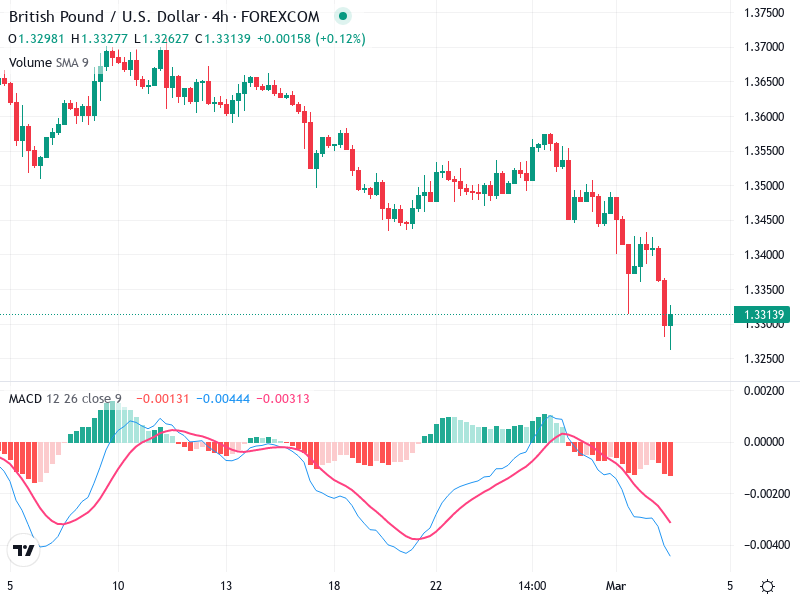
Consider buying if the price breaks and closes above 1.3250 with strong volume, indicating continuation of the bullish trend.

A break below the 1.3150 support with increased volume may suggest a potential reversal to bearish sentiment.

Monitor for confirmation of trend continuation or reversal around the key support and resistance levels, and watch for strong volume movements for additional confirmation.

The AI Technical Analysis Center is an informational tool only and does not constitute investment or trading advice.
This site is registered on wpml.org as a development site. Switch to a production site key to remove this banner.