Generic selectors
Exact matches only
Search in title
Search in content
Post Type Selectors

Popular stocks

Crypto

CFD

Currencies

Support

Gold

GBP/USD – Technical Analysis – 4h

September 1, 2025 07:07

Quick Summary

The GBP/USD 4-hour chart is showing potential for a bullish reversal after breaking above key resistance levels.

The analysis suggests a cautiously optimistic outlook, with recent price patterns indicating a shift in trend.

Traders should pay close attention to key levels and market indicators for further confirmation.

Candlestick Analysis

There appears to be a recent bullish engulfing pattern near the 1.35000 level, signaling potential reversal from the bearish trend.

The overall short-term trend has shifted from a previous downtrend to a potential bullish reversal as indicated by the recent higher lows and higher highs.

A breakout is observed above the 1.35000 resistance zone, suggesting potential continuation of the bullish momentum.

MACD Analysis

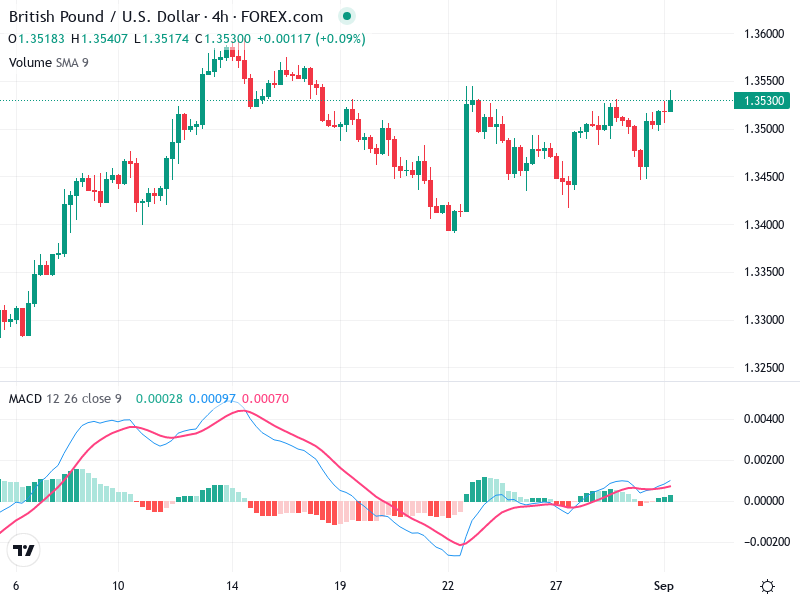
The MACD line is crossing above the Signal line, indicating a bullish crossover. This is typically a buy signal suggesting upward momentum.

The MACD histogram is showing increasing positive bars, supporting the idea of strengthening bullish momentum.

No significant divergences are noted between MACD and the price action, confirming the current bullish movement.

Volume Analysis

There are moderate volume levels accompanying the recent price increases, which supports the strength of the breakout.

No unusual spikes are observed, indicating regular market activity rather than strong institutional intervention.

The volume patterns reflect a steady accumulation phase supporting the bullish case.

Support & Resistance

Key support is around 1.34600, which held during prior declines.

Key resistance is initially at 1.35500. If breached, it could open the path towards the next resistance around 1.36000.

These levels are crucial for confirming the direction of the trend in the coming sessions.

Actionable Insights

Consider a buy at current levels, with a stop loss below 1.34600. Watch for strength above 1.35500 as an additional entry confirmation.

A reversal below 1.35000 might indicate short-term bearish correction; consider selling if confirmed by volume and MACD crossover to bearish.

If open positions have been entered at lower levels during the consolidation phase, holding is advisable with trailing stop-loss.

The AI Technical Analysis Center is an informational tool only and does not constitute investment or trading advice.
This site is registered on wpml.org as a development site. Switch to a production site key to remove this banner.