December 19, 2025 13:03
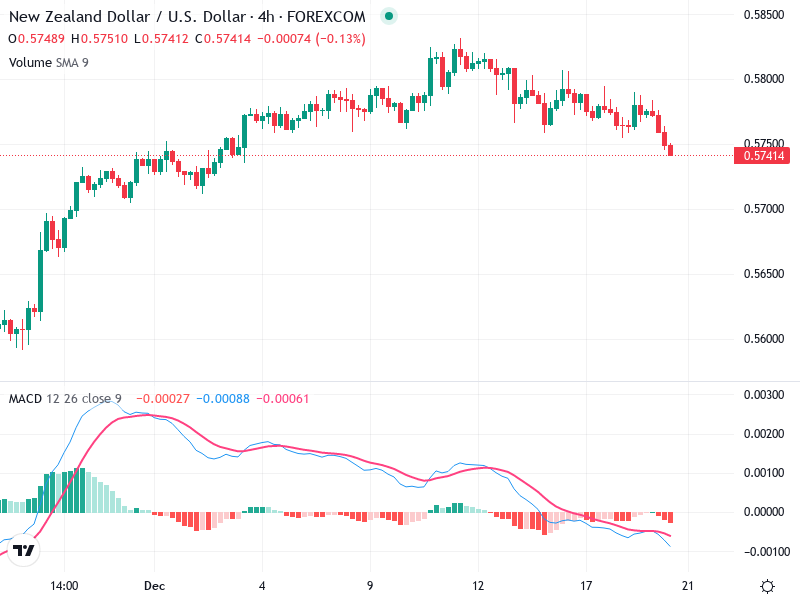
The chart currently reflects a consolidation phase following a previous uptrend, indicating a period of indecision in the market. Trading within a narrow range, the price action is neither strongly bullish nor bearish at the moment. Patterns suggest that the asset is awaiting fresh signals to determine its next move.
The chart exhibits signs of consolidation after a previous uptrend, with several doji and small-bodied candles indicating indecision in the market.
No prominent bullish or bearish reversal patterns appear, suggesting the market is waiting for fresh signals.
The trend has shifted from a bullish move to a sideways consolidation, suggesting a period of indecision or distribution after the uptrend seen earlier.
The MACD line is nearing a bearish crossover with the Signal line, suggesting potential downward momentum.
The histogram shows decreasing bullish momentum as it approaches the zero line from above.
No clear MACD divergences are observed. The MACD movements seem to align with the price action, confirming the current sideways trend.
Volume appears stable with no significant spikes, supporting the sideways price action. There are no immediate signs of accumulation or distribution.
Low volume during consolidation indicates lack of conviction among traders, often preceding a potential breakout.
No unusual volume spikes that suggest institutional activity are visible, indicating caution among larger players as well.
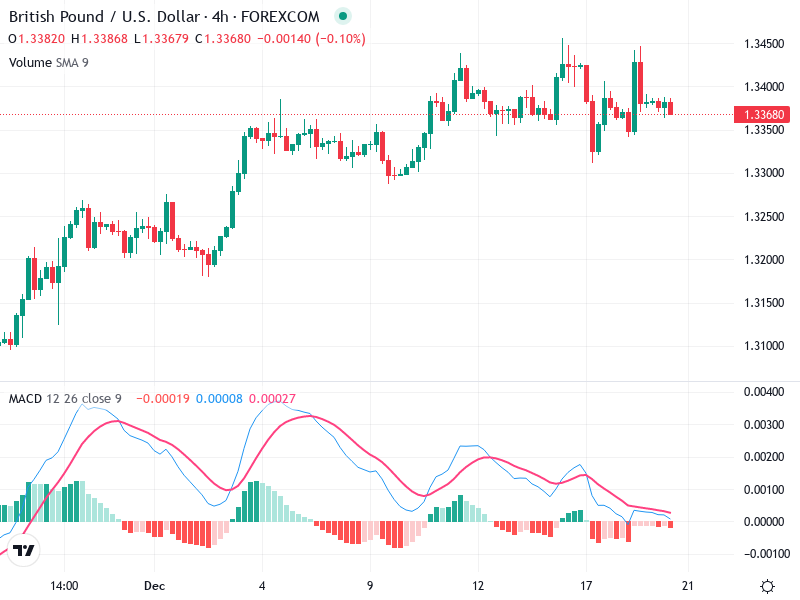
Resistance: Around 1.3400, important for any upward move.
Support: Around 1.3350, critical to hold for bulls to maintain some control.
A breakout above 1.3400 with volume could signal a continuation of the uptrend.
Consider buying if price breaks and closes above 1.3400 with strong volume.
Selling upon a breakdown below 1.3350 with volume confirmation.
Holding positions within this range is advisable until clearer signals emerge.