Generic selectors
Exact matches only
Search in title
Search in content
Post Type Selectors

Popular stocks

Crypto

CFD

Currencies

Support

Gold

GBP/USD – Technical Analysis – 4h

December 30, 2025 13:04

Quick Summary

The GBP/USD 4-hour chart presents an interesting technical scenario with mixed signs. While the overall trend shows bullish characteristics with higher highs and lows, certain indicators suggest caution. The asset faces resistance near 1.3550, a pivotal point for future movements.

Traders should monitor key levels and indicators closely to determine potential market direction.

Candlestick Analysis

The overall trend appears bullish, with a series of higher highs and higher lows.

There is no clear candlestick pattern like a bullish engulfing or hammer, indicating consolidation around recent highs.

Several small-bodied candles suggest indecision, possibly reflecting a sideways move near the top of the upward trend.

MACD Analysis

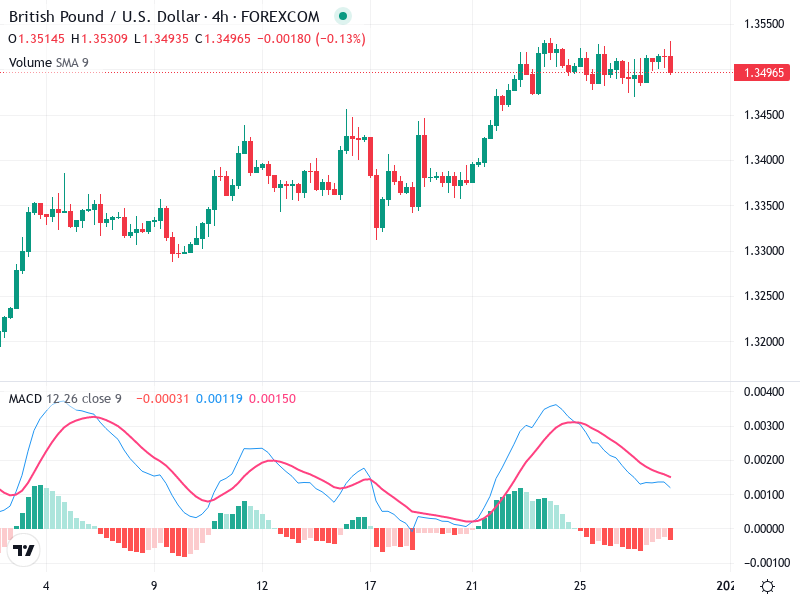
The MACD line appears to have crossed below the Signal line, signaling a potential bearish reversal, or at least a waning of recent bullish momentum.

The MACD histogram shows declining positive momentum, reinforcing a slowdown in bullish action.

There is no significant divergence observed between MACD and price, suggesting that price movements are currently aligned with momentum indicators.

Volume Analysis

The volume remains relatively stable, suggesting that the recent price consolidation is matched by stable trading interest.

A lack of significant volume increase on recent upward movements could undermine the strength of a bullish continuation.

There are no standout volume spikes indicating strong institutional activity or reversal signals.

Support & Resistance

Key resistance is observed around the 1.3550 level, which aligns with recent attempts to rise further.

Considerable support can be identified around 1.3400, which has held in previous consolidations.

Monitor the support level at 1.3450 for potential downside risk if breached.

Actionable Insights

Consider buying if price breaks and holds above 1.3550 with increased volume confirming the breakout strength.

Potential short positions could be explored if the price fails to maintain above current levels and moves below the 1.3450 support with increased bearish momentum.

A hold strategy may be advisable for long positions until a definitive breakout or breakdown occurs, given the current range-bound action.

The AI Technical Analysis Center is an informational tool only and does not constitute investment or trading advice.
This site is registered on wpml.org as a development site. Switch to a production site key to remove this banner.