Generic selectors
Exact matches only
Search in title
Search in content
Post Type Selectors

Popular stocks

Crypto

CFD

Currencies

Support

Gold

GBP/USD – Technical Analysis – 4h

December 31, 2025 13:04

Quick Summary

The chart provides a detailed technical analysis of the asset, highlighting key patterns and potential future price movements. The current setup suggests crucial levels and signals that traders should pay attention to in the coming sessions.

This analysis focuses on recent trends and market indicators to provide a comprehensive overview of possible directions.

Candlestick Analysis

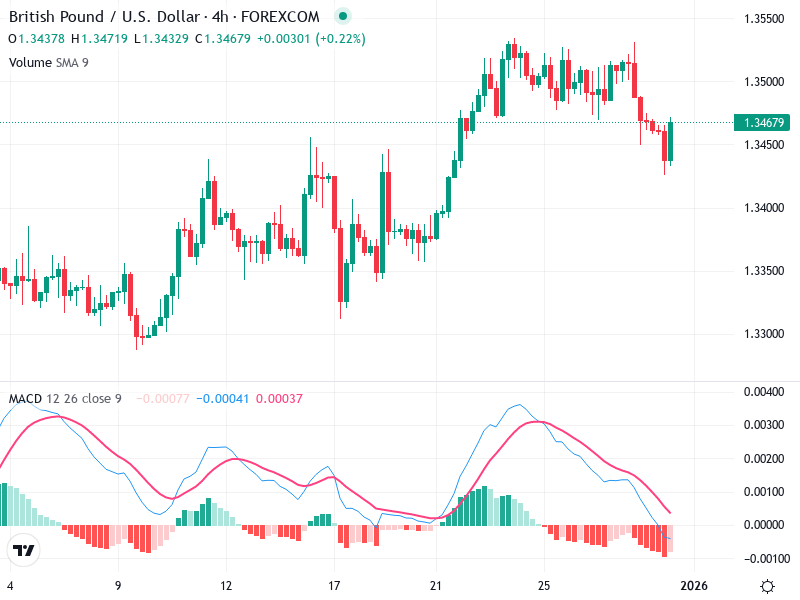
There appears to be a potential hammer pattern in the recent candles, which is typically viewed as a bullish reversal signal after a downtrend, indicating buyers may be stepping back in.

The current trend shows a bullish movement leading to a peak, followed by a corrective phase, with the current candlestick showing signs of a potential bullish reversal.

A recent breakout above the 1.3450 level, followed by a pullback, suggests that the current price near 1.34679 may be a retesting of this previous resistance-turned-support level.

MACD Analysis

The MACD line is below the signal line, indicating a bearish phase; however, their convergence suggests a possible bullish crossover soon.

The MACD histogram is negative but decreasing, which suggests that bearish momentum might be weakening.

No clear divergence between MACD and price action is currently observed.

Volume Analysis

Volume appears steady overall, with no significant spike during the decline, suggesting a lack of strong momentum in the downtrend.

The absence of high volume during the recent drop may imply that the move does not have strong conviction from traders.

This stable volume could indicate mixed market sentiment regarding the current price movements.

Support & Resistance

The 1.3450 level has emerged as a key support zone, particularly in alignment with the recent pullback observed.

Recent highs around 1.3500 might act as immediate resistance should the price attempt to rise.

Actionable Insights

Consider entering a buy position if the price sustains above the 1.3450 support and should the MACD confirm a bullish crossover.

Watch for confirmation of reversal patterns accompanied by increased volume and any potential bullish MACD crossover to support an upward move.

Be cautious if the price falls below the 1.3450 support with high volume, as this may signal renewed bearish sentiment.

The AI Technical Analysis Center is an informational tool only and does not constitute investment or trading advice.
This site is registered on wpml.org as a development site. Switch to a production site key to remove this banner.