Generic selectors
Exact matches only
Search in title
Search in content
Post Type Selectors

Popular stocks

Crypto

CFD

Currencies

Support

Gold

GBP/USD – Technical Analysis – 4h

January 6, 2026 13:05

Quick Summary

The GBP/USD 4-hour chart shows an interesting dynamic between buyers and sellers. Recent price movements hint at potential shifts in the trend. Monitoring key indicators could provide clarity on future movements.

Candlestick Analysis

Recently, there is a large bearish candle that suggests selling pressure after a recent uptrend.

The chart shows a bullish trend leading up to the present, but recent downward movement indicates potential consolidation.

The sharp decline after the latest high suggests a pullback. Key support could be around the recent consolidation zone, approximately 1.34500.

MACD Analysis

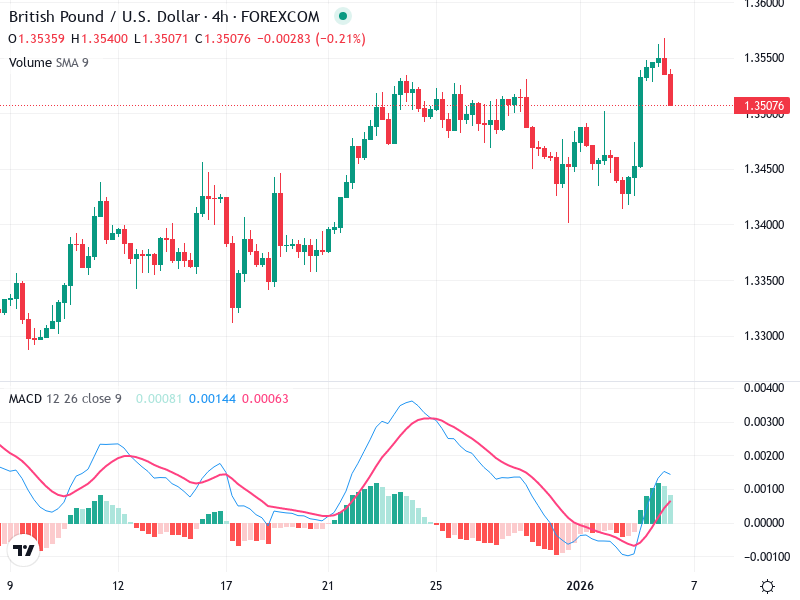
The MACD line is above the Signal line, indicating bullish momentum, but the gap is narrowing.

The histogram shows decreasing bullish momentum, as indicated by the shrinking green bars.

No significant divergences are currently apparent between the MACD and price action, but the potential slowing momentum should be watched.

Volume Analysis

Volume corresponding to the recent bearish candle is significant, suggesting strong selling activity.

The volume supports the bearish move, indicating possible institutional involvement.

Any large volume spikes that do not result in corresponding price movement could suggest accumulation or distribution phases.

Support & Resistance

The recent highs around 1.36000 serve as a strong resistance zone.

Support is likely around 1.34500, where the price consolidated before the last surge.

Monitor these levels as potential reversal points for ongoing trends.

Actionable Insights

Consider buying if the price bounces off the 1.34500 support with confirmation from bullish candlestick patterns.

A break below 1.34500 could provide short-selling opportunities. Watch for confirmation with a bearish candlestick close.

Caution is advised as the bullish momentum wanes; holding may be wise until a clearer trend emerges.

The AI Technical Analysis Center is an informational tool only and does not constitute investment or trading advice.
This site is registered on wpml.org as a development site. Switch to a production site key to remove this banner.