Generic selectors
Exact matches only
Search in title
Search in content
Post Type Selectors

Popular stocks

Crypto

CFD

Currencies

Support

Gold

GBP/USD – Technical Analysis – 4h

January 7, 2026 13:04

Quick Summary

The chart displays a complex set of indicators requiring close monitoring. Recent patterns suggest potential movements that demand attention around key support and resistance levels.

The technical indicators reveal a nuanced outlook on the asset, hinting at possible trend reversals or continuations.

Candlestick Analysis

The overall trend in recent periods appears to be bullish, with a series of higher highs and higher lows, though there is a current pullback.

There is a possible bullish engulfing pattern followed by a rally, and a recent formation that resembles a doji, indicating potential indecision.

The price breaking above 1.3500 acted as a resistance previously; the current pullback tests this as a potential support.

MACD Analysis

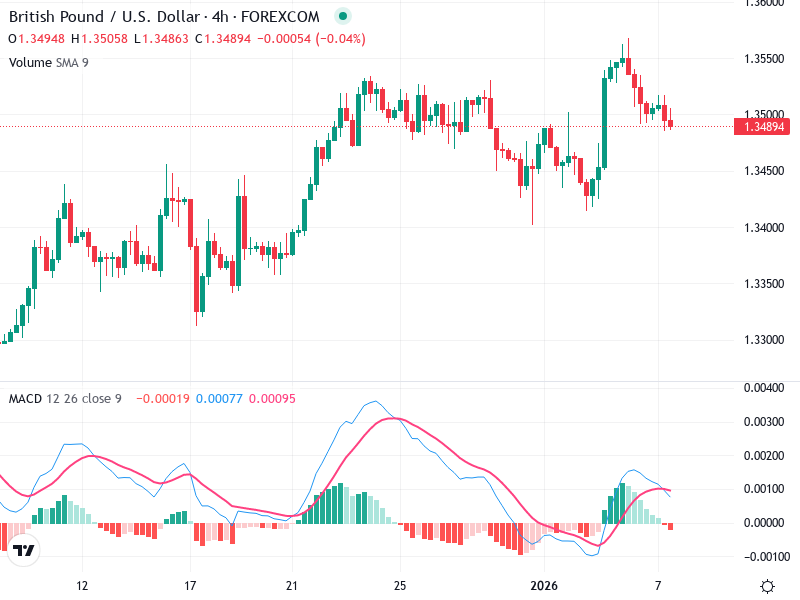
There was a recent bullish crossover where the MACD line crossed above the Signal line, suggesting potential upward momentum. However, the lines are converging, signaling a potential reduction in momentum.

The histogram shows decreasing bullish momentum as it starts to trend towards zero, indicating that bullish pressure is weakening.

The MACD does not show clear divergence with current price peaks but keep an eye on it for possible early signals.

Volume Analysis

Volume has shown a significant rise during bullish moves, suggesting strong participation. The recent decrease in volume aligns with the pullback, indicating reduced buying pressure.

Volume spikes with price rallies suggest possible institutional activity, supporting bullish moves.

Support & Resistance

The area around 1.3480-1.3500 could act as immediate support, derived from its previous resistance role.

Immediate resistance can be seen around the recent high near 1.3550.

Actionable Insights

Consider entering long positions if the price holds above the 1.3500 support with an increase in volume and positive MACD momentum.

Consider selling if the price declines below 1.3480 with strong bearish volume supporting the move.

Watching for a retest of support levels or confirmation of a trend reversal with improving momentum.

The AI Technical Analysis Center is an informational tool only and does not constitute investment or trading advice.
This site is registered on wpml.org as a development site.