Generic selectors
Exact matches only
Search in title
Search in content
Post Type Selectors

Popular stocks

Crypto

CFD

Currencies

Support

Gold

GBP/USD – Technical Analysis – 4h

January 15, 2026 13:05

Quick Summary

The GBP/USD 4-hour chart reveals a sideways to slightly bearish trend.

Key levels are forming indicating potential breakout or pullback opportunities.

Market sentiment shows a slight bearish edge due to MACD behavior.

Candlestick Analysis

There are no prominent candlestick patterns such as bullish engulfing or doji formations currently visible.

The chart shows minor patterns indicating attempted reversals, but nothing definitive.

The current trend appears sideways to slightly bearish, with recent lower highs and lower lows.

MACD Analysis

The MACD line is below the Signal line, indicating bearish momentum.

Recently observed a bearish crossover, reinforcing the bearish sentiment.

The histogram shows negative bars, suggesting stronger bearish momentum.

Volume Analysis

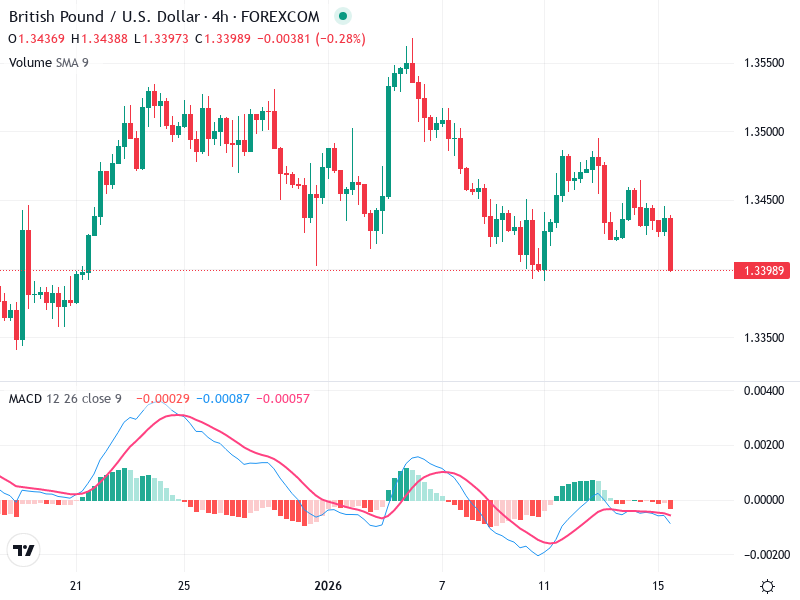
Volume appears to be consistent without significant spikes, suggesting steady trading.

The volume doesn't strongly support any significant price movement, indicating consolidation.

No unusual volume spikes were noted, indicating no recent strong buying or selling pressure.

Support & Resistance

Key support is near the 1.34000 level, showing resilience.

Key resistance can be observed around the 1.35300 level.

These levels suggest potential breakout or pullback opportunities.

Actionable Insights

Consider a cautious approach; a break below 1.34000 could be a sell signal if confirmed by volume.

Watch for a potential reversal or signals of bullish crossover in MACD for buying opportunities.

Look for confirmation with increased volume at breakouts or pullbacks.

The AI Technical Analysis Center is an informational tool only and does not constitute investment or trading advice.
This site is registered on wpml.org as a development site. Switch to a production site key to remove this banner.