Generic selectors
Exact matches only
Search in title
Search in content
Post Type Selectors

Popular stocks

Crypto

CFD

Currencies

Support

Gold

GBP/USD – Technical Analysis – 4h

January 20, 2026 13:04

Quick Summary

The chart of indicates a recent breakout from a sideways trend, driven by growing bullish momentum. The asset’s price action reflects a shift from previous bearish conditions to a more positive market sentiment.

Key indicators suggest a sustained upward move, albeit with some resistance challenges ahead.

Candlestick Analysis

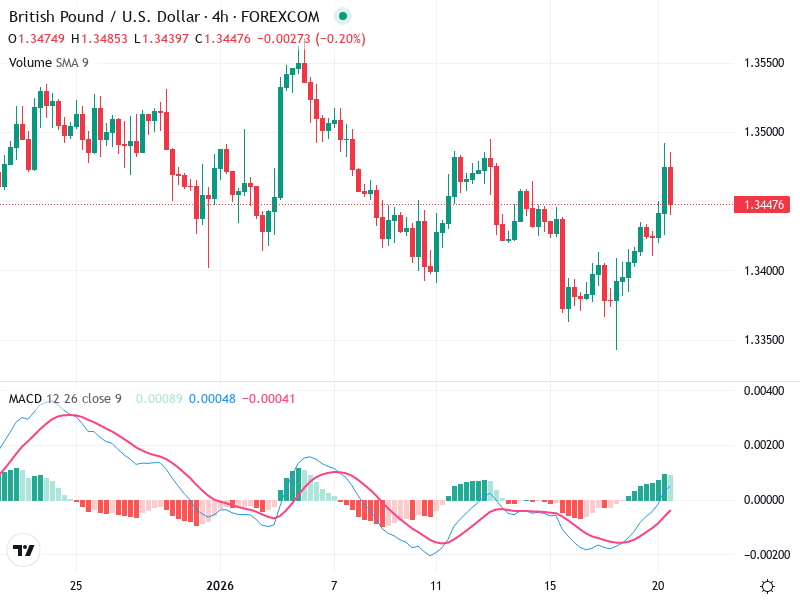
A bullish engulfing pattern is visible just before the latest price rise, indicating a potential reversal from a previous downtrend.

Currently, there is a rejection candle (long upper wick), suggesting potential resistance or selling pressure at higher levels.

The chart shows a recent bullish reversal after a period of sideways movement, transitioning from a prior bearish trend.

MACD Analysis

The MACD line is above the Signal line, a bullish crossover, reinforcing the recent price rise.

The MACD histogram is positive and expanding, indicating increasing bullish momentum.

No significant divergence is noted between price action and MACD, which supports current price strength.

Volume Analysis

Volume shows an increase during the recent upward move, suggesting support for the breakout.

Rising volume during an upward price movement supports the strength of the move, indicating potential institutional interest.

No exceptional spikes noted in the latest candles, but elevated volume generally supports the bullish trend.

Support & Resistance

Immediate support is around 1.3420, previously broken resistance.

Further support lies near 1.3350, where recent consolidation occurred.

Current resistance near the latest high around 1.3500. Beyond that, watch for resistance around 1.3550.

Actionable Insights

Consider buying on pullbacks to the 1.3420 level, with a tight stop below 1.3400, aiming for a target near 1.3500.

Short opportunities may arise if the price fails to hold above 1.3420, targeting the 1.3350 level.

Existing positions could be held with a stop below 1.3400, looking for a continuation towards 1.3500.

The AI Technical Analysis Center is an informational tool only and does not constitute investment or trading advice.
This site is registered on wpml.org as a development site. Switch to a production site key to remove this banner.