Generic selectors
Exact matches only
Search in title
Search in content
Post Type Selectors

Popular stocks

Crypto

CFD

Currencies

Support

Gold

GOLD – Technical Analysis – 4h

January 27, 2026 17:03

Quick Summary

The chart for gold Futures shows a strong uptrend with potential signs of consolidation. The asset is trading near key levels, indicating possible changes in price direction.

gold Futures have demonstrated sustained bullish momentum, but recent patterns suggest traders should exercise caution.

Candlestick Analysis

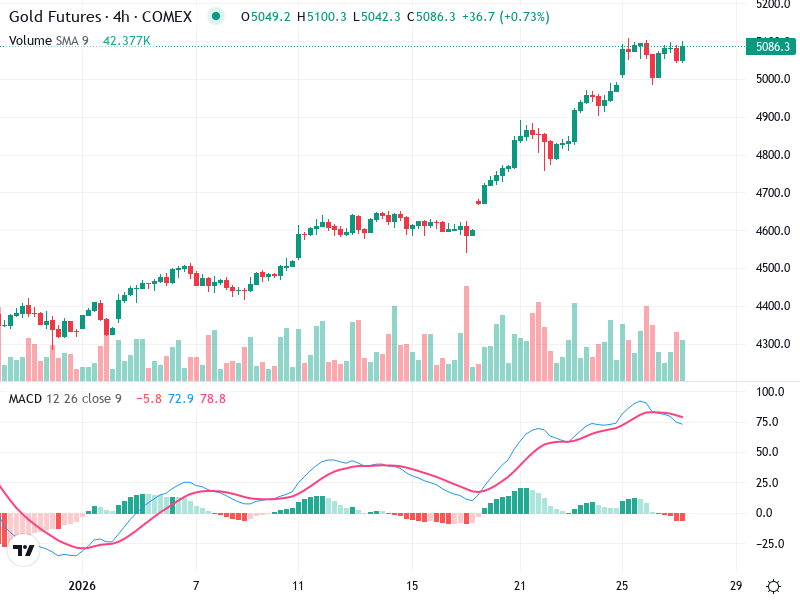
The chart shows a strong uptrend, with several bullish candlestick patterns prevalent throughout the trend.

Towards the right, small-bodied candles suggest indecision, potentially forming a consolidation phase or a 'Doji' pattern.

A breakout above 5100 could signal further upside potential, while a pullback below 5000 might indicate a short-term correction.

MACD Analysis

The MACD line is above the signal line, but the two lines are converging, indicating a potential for a bearish crossover if the trend weakens.

The histogram shows decreasing momentum, suggesting the bullish momentum is waning.

No significant divergences currently observed.

Volume Analysis

Volume has been generally consistent throughout the uptrend but shows no significant spikes or drops, supporting the price trend.

The recent low volume combined with small candles suggests less buying pressure, cautioning against a strong immediate continuation without further confirmation.

No unusual volume spikes indicating institutional activity.

Support & Resistance

Strong support is seen at 4800, which has acted as a previous resistance turned support after the recent breakout.

Resistance is seen around 5100, where the price is currently testing.

Monitoring these levels will give insights into the next potential moves for traders.

Actionable Insights

Consider buying on a confirmed breakout above 5100 with strong volume support, suggesting renewed buying interest.

If unable to break 5100 with conviction and confirmed by volume, consider shorting or taking profits, especially if the price falls below 5000.

Current holders should watch for a potential pullback to 5000 as an opportunity to add more positions if the support holds.

The AI Technical Analysis Center is an informational tool only and does not constitute investment or trading advice.
This site is registered on wpml.org as a development site. Switch to a production site key to remove this banner.