Generic selectors
Exact matches only
Search in title
Search in content
Post Type Selectors

Popular stocks

Crypto

CFD

Currencies

Support

Gold

GOLD – Technical Analysis – 4h

January 29, 2026 17:03

Quick Summary

The gold Futures chart reveals crucial insights regarding recent market behavior.

The asset has recently experienced a sharp decline after a bullish trend.

Candlestick Analysis

Recent candlesticks show a sharp drop following a period of strong upward movement, indicating a potential reversal.

The presence of a long red candlestick suggests bearish sentiment has emerged strongly.

The sharp decline may represent a correction after a bullish trend.

MACD Analysis

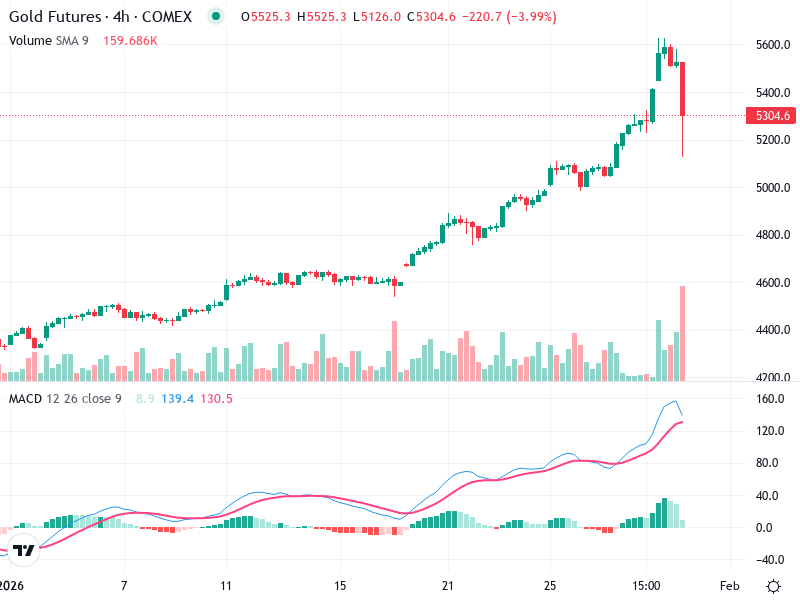
The MACD is above the Signal line, indicating previous bullish momentum, but the gap appears to be narrowing.

The MACD histogram is decreasing, showing a weakening in bullish momentum.

No clear divergences noted, but the weakening MACD may foreshadow a shift in sentiment.

Volume Analysis

A significant spike in volume coincides with the recent decline, suggesting strong selling pressure.

The high volume on the bearish candle supports the price move, indicating strong conviction.

The large volume spike suggests potential institutional selling at recent highs.

Support & Resistance

The area around 5200 acts as a key support zone, tested by recent price pullbacks.

Resistance is noted at the recent highs near 5525, requiring strong bullish momentum to break.

A break below 5200 might indicate further downside.

Actionable Insights

Consider buying if the price finds support around 5200 with bullish reversal patterns.

Selling can be considered if the 5200 level breaks significantly, with stops above recent highs.

Holding is advised until clearer signals develop, especially around key levels.

The AI Technical Analysis Center is an informational tool only and does not constitute investment or trading advice.
This site is registered on wpml.org as a development site. Switch to a production site key to remove this banner.