Generic selectors
Exact matches only
Search in title
Search in content
Post Type Selectors

Popular stocks

Crypto

CFD

Currencies

Support

Gold

GOLD – Technical Analysis – 4h

February 3, 2026 17:03

Quick Summary

The chart displays a dynamic journey for the asset, showcasing recent volatility as it navigates through varied levels of support and resistance.

Key technical indicators suggest potential for bullish momentum, though vigilance for rapid changes remains crucial. The asset reflects the market’s indecisiveness with signs of both caution and opportunity.

Candlestick Analysis

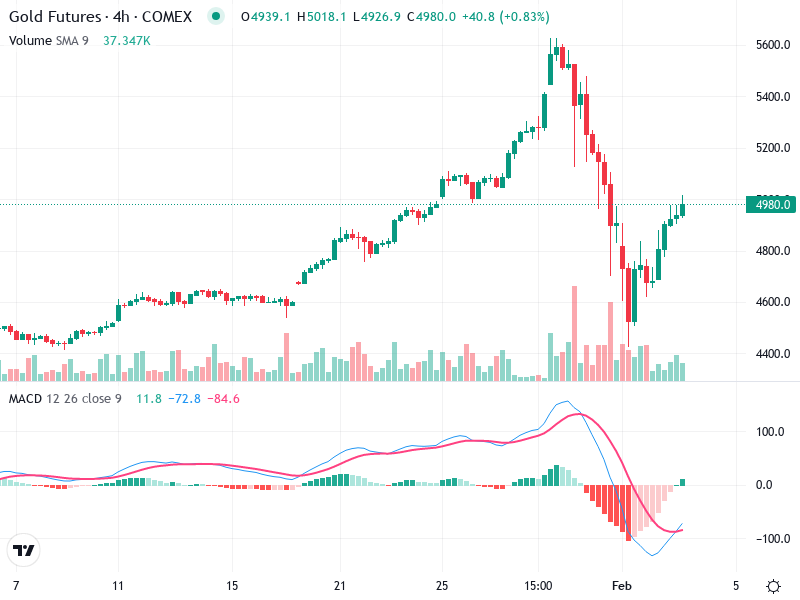
Significant patterns indicate a potential bullish reversal, evidenced by green candlesticks following a decline, similar to patterns like a morning star or bullish engulfing.

The chart reveals a strong bullish trend disrupted by a sharp decline, followed by recovery, highlighting volatility.

Above the 4800 level, a significant breakout suggests a previous resistance zone now acting as support.

MACD Analysis

A bullish crossover occurred as the MACD line rose above the Signal line, indicating a switch to positive momentum.

The histogram transition from negative to positive reinforces this momentum shift.

No divergences are apparent, with the MACD aligning with recent price recovery.

Volume Analysis

Noticeable volume spikes coincide with price movements, showing strong trading interest during the decline and recovery.

Volume increase during the initial drop and recovery suggests strong trading actions supported these moves.

Unusual volume spikes hint at potential institutional activity during these phases.

Support & Resistance

Key support at 4800 could cushion downturns, while resistance near 5200 may challenge upward momentum.

These levels are crucial for making reversal and breakout decisions.

Testing these levels may inform future price action strategies.

Actionable Insights

Consider long positions if the price holds above 4800 with strong volume and continued bullish MACD signs.

Watch for resistance testing near 5200, as failure to break could prompt shorting opportunities.

Monitor MACD and volume closely for continuation or reversal signals from current positions.

The AI Technical Analysis Center is an informational tool only and does not constitute investment or trading advice.
This site is registered on wpml.org as a development site. Switch to a production site key to remove this banner.