February 13, 2026 17:03
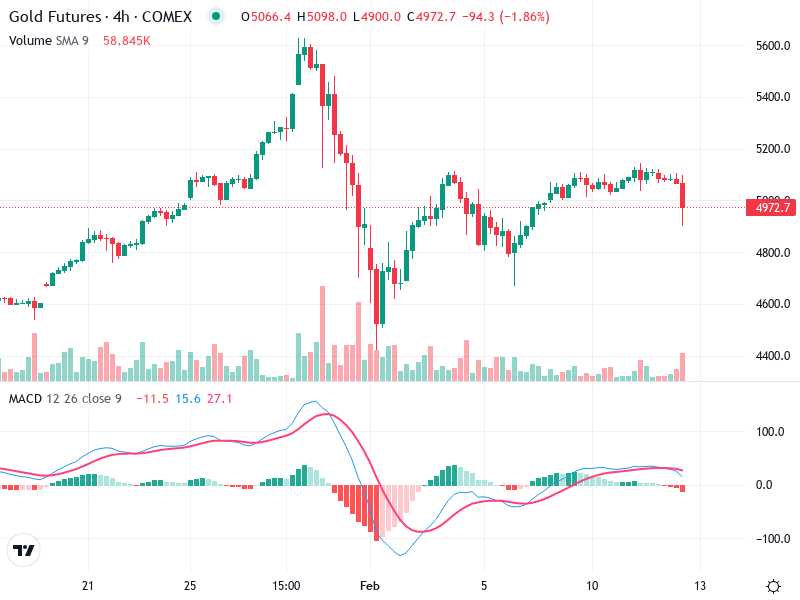
The gold Futures 4-hour chart reveals key market dynamics. Recently, the chart exhibited alternating bullish and bearish trends. A noticeable attempt at recovery has followed a significant price drop. The asset shows signs of potential bullish momentum.
The Gold Futures chart indicates alternating periods of bullish and bearish trends, with a recent recovery attempt after a significant drop.
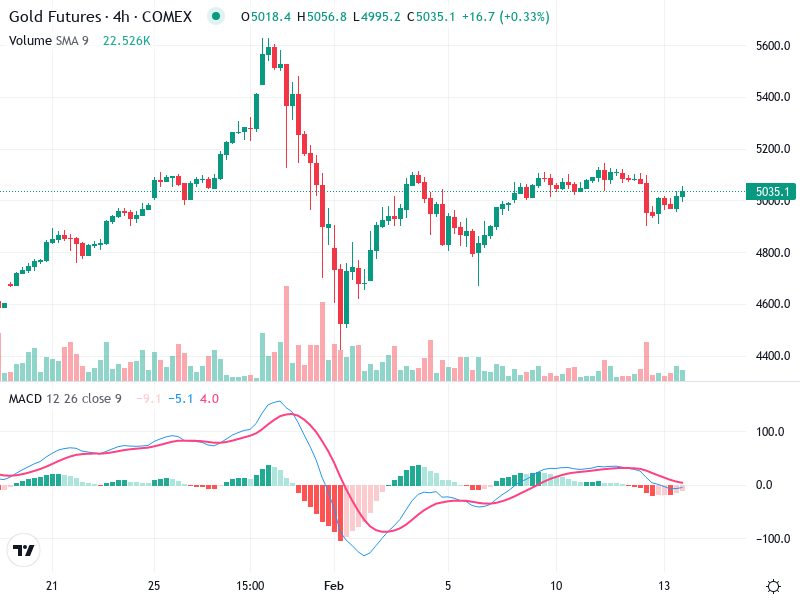
There's a potential double-bottom pattern around the 4800 level, suggesting a possible bullish reversal. The formation of several doji candles towards the end signals market indecision.
A potential breakout zone is noted around 5050, where previous highs were tested.
The MACD line is nearing a bullish crossover with the Signal line, indicating a potential uptrend for Gold Futures.
The histogram reflects declining negative momentum, supporting the possibility of a bullish shift.
No significant divergence is observed between MACD and price, suggesting alignment between price and momentum.
Volume increased significantly during the recent price drop, indicating strong selling pressure for Gold Futures.
During the recent price recovery phase, there's a slight decrease in volume, suggesting cautious buying or a lack of strong conviction.
Notable volume spikes coincide with major price movements, likely indicating institutional involvement.
Strong support is observed around 4800, based on previous price consolidations and the current rebound area for Gold Futures.
Key resistance is at 5050, which, if broken, could lead to further bullish momentum.
The notable levels of support and resistance are essential for planning trading strategies.
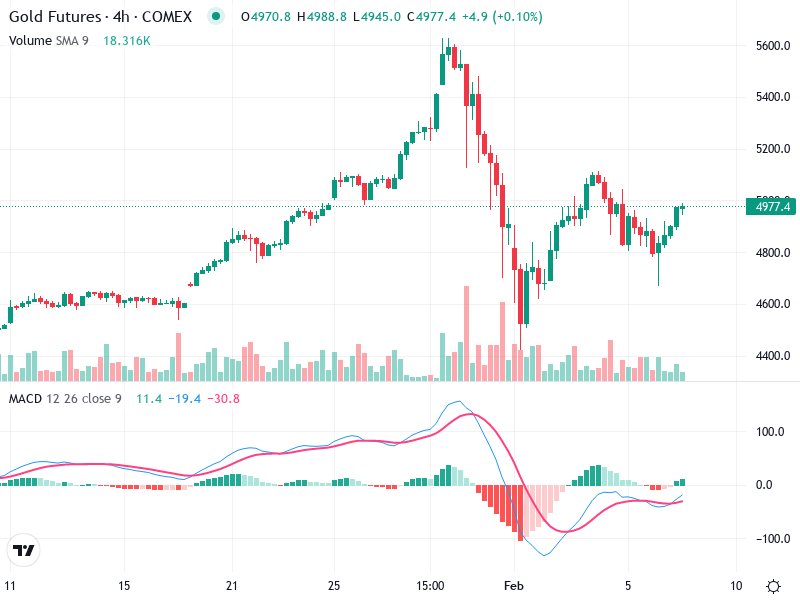
Consider entering a long position on a confirmed breakout above 5050 with volume support.
Close positions or consider shorting if the price falls back below 4800 with strong bearish momentum.
Continue holding current positions while monitoring for confirmation signals in either direction.