Generic selectors
Exact matches only
Search in title
Search in content
Post Type Selectors

Popular stocks

Crypto

CFD

Currencies

Support

Gold

GOLD – Technical Analysis – 4h

February 25, 2026 17:02

Quick Summary

The chart for reveals an interesting trend that traders should observe closely.

The recent price action showcases a potential breakout scenario, making a pivotal watch in the current market.

It’s crucial to monitor how navigates its current resistance and support levels.

Candlestick Analysis

A notable bullish trend is observed from early February onwards, highlighted by a series of higher highs and higher lows.

There are no clear reversal patterns such as a bearish engulfing or doji immediately evident in the current view.

The current price is testing a potential breakout zone at the 5231 level. A sustained move above this could signal a continuation of the bullish trend.

MACD Analysis

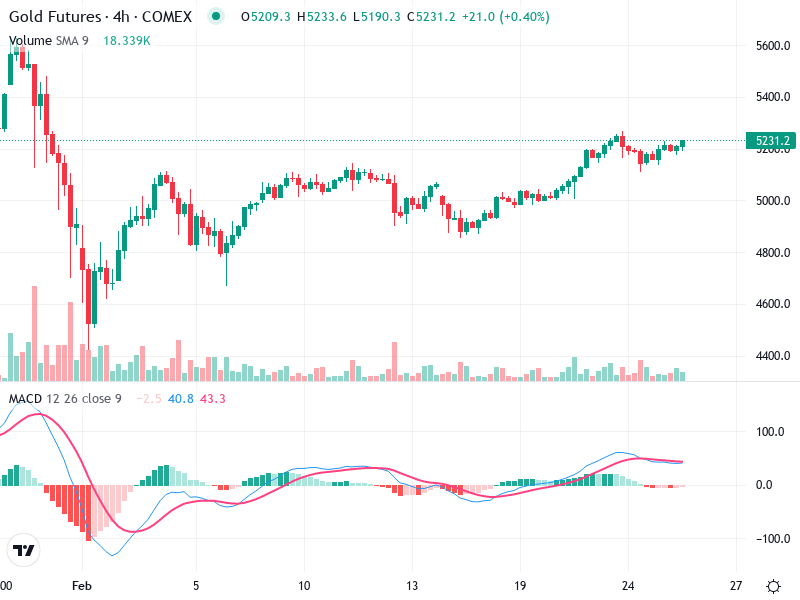
The MACD line (blue) is above the Signal line (red), supporting a bullish outlook.

The histogram shows decreasing bullish momentum, suggesting a potential slowdown. However, it remains above zero, indicating positive momentum.

There is no clear divergence between the MACD and price action at this point.

Volume Analysis

Volume has been declining slightly as the price approaches the current resistance level, sometimes indicating a lack of strong conviction in the current move.

The volume does not strongly support the recent price movements, suggesting caution if looking for a breakout.

No significant spikes in volume suggesting institutional buying or selling were observed.

Support & Resistance

Support is around 5000, acting as a strong base following the initial recovery.

Resistance is at 5231, where the price is currently testing.

The resistance at 5231 is crucial. A breakout above this on strong volume could lead to further upside targets.

Actionable Insights

Consider buying if the price breaks above 5231 with strong volume and bullish candlestick confirmation.

If the price fails to break through this resistance convincingly, consider holding off on new positions or tightening stop-losses for existing long positions to manage risk.

Watch for a breakout or rejection at the 5231 resistance level, with particular attention to volume and candlestick patterns for confirmation signals.

The AI Technical Analysis Center is an informational tool only and does not constitute investment or trading advice.
This site is registered on wpml.org as a development site. Switch to a production site key to remove this banner.