Generic selectors
Exact matches only
Search in title
Search in content
Post Type Selectors

Popular stocks

Crypto

CFD

Currencies

Support

Gold

GOLD – Technical Analysis – 4h

February 27, 2026 17:03

Quick Summary

The chart exhibits a strong upward momentum as seen in the recent breakout. Volume and technical indicators are aligning with a bullish trend. Investors should keep an eye on critical resistance levels and potential retracement zones.

This analysis dives into candlestick patterns, MACD shifts, and significant support and resistance levels.

Candlestick Analysis

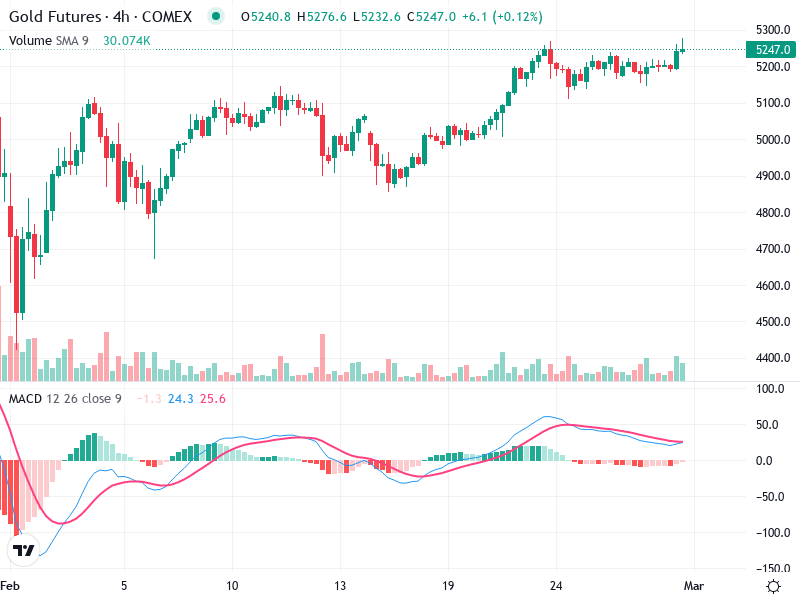
There is a noticeable bull trend with several bullish continuation patterns such as consecutive bullish candlesticks. Recently, a breakout has occurred, pushing above previous local highs.

The trend is currently bullish, with the price forming higher highs and higher lows. A sideways consolidation period was evident before the recent upward breakout.

The breakout above 5240 is significant, confirming bullish momentum. The next resistance zone is near 5276.

MACD Analysis

The MACD line is above the signal line, indicating a bullish crossover. This suggests upward momentum.

The histogram is positive, which shows increasing buying momentum. The increments in the histogram further confirm this bullish trend.

There are no clear divergences present currently. Trend and MACD are in alignment.

Volume Analysis

Volume has increased during the recent breakout, supporting the bullish momentum. Sustained higher volume provides additional confidence in the breakout’s validity.

The increase in volume suggests institutional interest, aligning with the sharp price increase.

Recent volume spikes coincide with price gains, confirming strong buying interest.

Support & Resistance

Significant support is likely around 5200, where price previously consolidated.

Immediate resistance is near 5276, the recent high. A break above this could lead to further gains.

Actionable Insights

Consider buying on pullbacks to the recent support of 5240, targeting moves towards 5276 and beyond. Utilize a tight stop-loss below 5200.

Watch for failed attempts to break 5276. If selling pressure increases, it might be prudent to sell or take profits.

If currently long, maintain positions but watch for any bearish reversals or volume changes.

The AI Technical Analysis Center is an informational tool only and does not constitute investment or trading advice.
This site is registered on wpml.org as a development site. Switch to a production site key to remove this banner.