Generic selectors
Exact matches only
Search in title
Search in content
Post Type Selectors

Popular stocks

Crypto

CFD

Currencies

Support

Gold

GOLD – Technical Analysis – 4h

March 3, 2026 17:02

Quick Summary

The gold futures chart presents dynamic movement, marked by recent bearish pullback followed by recovery attempts. Significant levels of support and resistance dictate the likely direction in the near term.

Traders should observe momentum indicators to gauge potential shifts in trend and adjust their strategies accordingly.

Candlestick Analysis

The chart shows a strong bearish candlestick pattern followed by a bullish recovery, potentially forming a hammer pattern. This suggests a potential reversal.

The overall trend has been bullish, but there is a recent bearish pullback.

A breakout near the 5200 level could signify continued upward momentum, whereas a pullback around 5000 might indicate more downward pressure.

MACD Analysis

The MACD line has crossed below the Signal line, indicating a bearish crossover. This suggests downward momentum.

The MACD histogram shows increasing negative bars, reinforcing the bearish sentiment.

No significant divergence is noted at the moment; the price action and MACD movement are aligned.

Volume Analysis

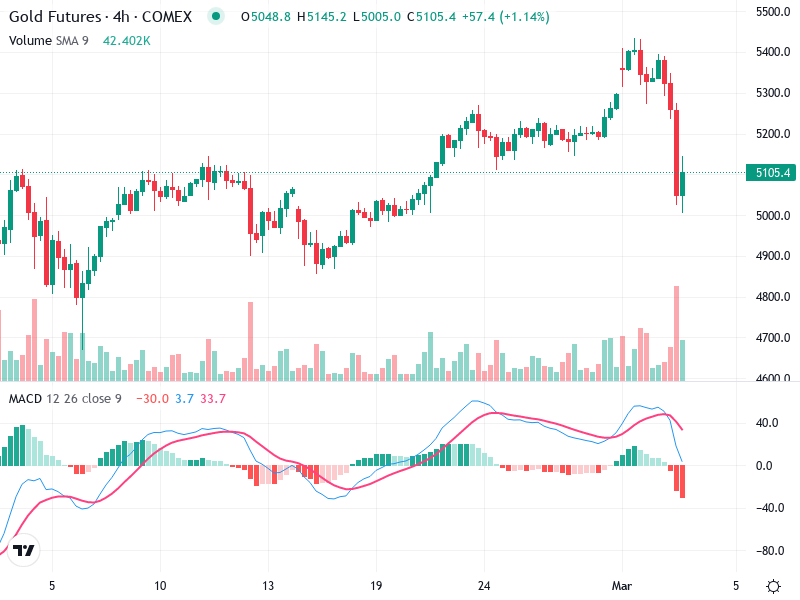
There's a notable spike in volume during the recent sell-off, suggesting strong participation and perhaps institutional selling.

The increased volume during the drop supports the sharp decline in price, indicating strong selling pressure.

The most pronounced volume spike occurred during the latest drop, necessitating close monitoring for potential recovery or further decline.

Support & Resistance

Around 5000 serves as a critical support level; failure to maintain this could lead to further declines.

The area near 5200-5300 is significant resistance. A successful break above this could indicate a resumption of the upward trend.

Monitoring these levels is crucial for potential breakouts or breakdowns.

Actionable Insights

Consider buying on confirmation of a reversal signal or a break above 5200 with sustained volume.

Watch for a break below 5000 on continued high volume for short opportunities.

If uncertain, it may be wise to hold and observe the behavior around key levels.

The AI Technical Analysis Center is an informational tool only and does not constitute investment or trading advice.
This site is registered on wpml.org as a development site. Switch to a production site key to remove this banner.