Generic selectors
Exact matches only
Search in title
Search in content
Post Type Selectors

Popular stocks

Crypto

CFD

Currencies

Support

Gold

GOLD – Technical Analysis – 4h

March 4, 2026 17:03

Quick Summary

The chart highlights the recent price movements of the asset, indicating key levels of support and resistance. It reflects the ongoing trends and potential turning points for traders to consider.

The asset has shown fluctuations in momentum, signaling possible consolidation phases before the next significant move.

Candlestick Analysis

The chart shows a recent bullish trend followed by a sharp pullback, currently indicating potential consolidation.

A significant sharp decline suggests a potential bearish engulfing pattern. The recovery attempt is forming higher lows, signaling potential support.

The recent high near 5400 is a potential resistance, while 5100 appears to be a strong support level.

MACD Analysis

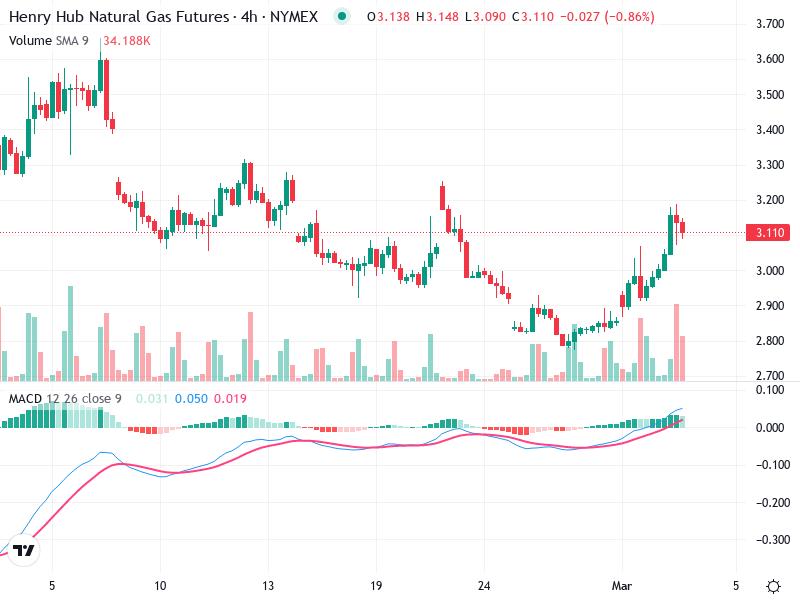
The MACD line has crossed below the signal line, indicating a bearish crossover, suggesting weakening momentum.

The histogram shows decreasing negative momentum, potentially indicating the start of stabilization.

There is a minor divergence where prices are forming higher lows while the MACD suggests bearish momentum, possibly indicating a weakening of the downtrend.

Volume Analysis

Noticeable volume increase during the recent price decline suggests strong selling pressure. Current volume on recovery seems average.

The high volume during the decline supports the bearish move, but average volumes in the recovery phase may indicate uncertainty or consolidation.

The spike in volume could hint at possible institutional selling during the drop.

Support & Resistance

The level at 5100 is a key support, as it's held during recent pullbacks.

The 5400 level is resistance, marking the recent peak before the decline.

A break below 5100 could signal further downside, while breaking above 5400 might restore bullish sentiment.

Actionable Insights

Consider entry if price stabilizes above 5100 with bullish confirmation signals such as a MACD bullish crossover or increased buying volume.

Risk of further downside if 5100 breaks, with potential targets near 4900.

Watching for consolidation and a strong breakout in either direction before taking action.

The AI Technical Analysis Center is an informational tool only and does not constitute investment or trading advice.
This site is registered on wpml.org as a development site. Switch to a production site key to remove this banner.