Generic selectors
Exact matches only
Search in title
Search in content
Post Type Selectors

Popular stocks

Crypto

CFD

Currencies

Support

Gold

GOLD – Technical Analysis – 4h

September 9, 2025 07:12

Quick Summary

The chart of gold Futures (4h COMEX) currently exhibits a strong upward trajectory, consistently showcasing higher highs and lows.

However, signs of exhaustion are emerging, suggesting cautious observation of potential consolidation or pullback near prevailing levels.

Candlestick Analysis

The chart shows a strong bullish trend with multiple bullish candlesticks forming consecutively. There are no clear bearish reversal patterns like doji or bearish engulfing currently.

Recent price action suggests potential exhaustion as the upper wicks on the final candlesticks indicate some selling pressure.

The trend is clearly bullish, with prices showing higher highs and higher lows throughout the chart.

MACD Analysis

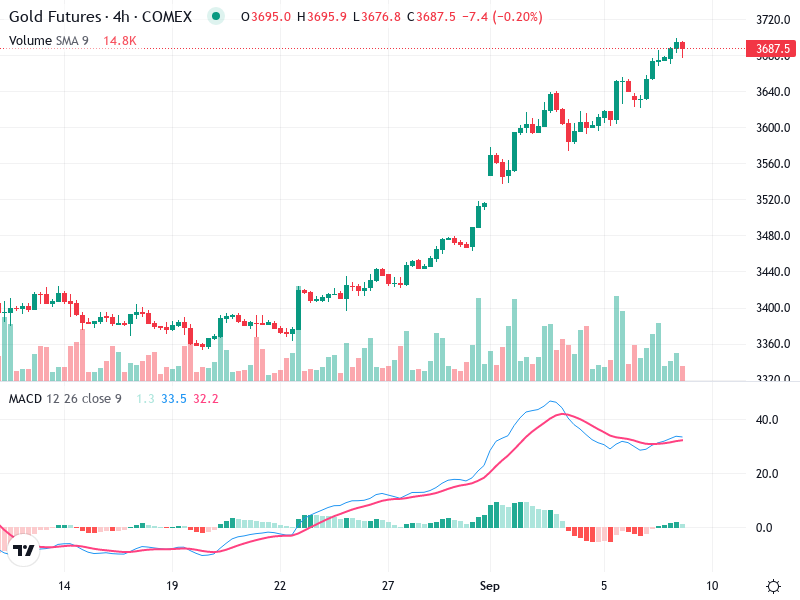
The MACD line is above the Signal line, indicating bullish momentum; however, they seem to be converging, which could signal waning strength.

The MACD histogram is decreasing, suggesting a reduction in bullish momentum and potential for a bearish crossover if the trend continues.

There's no clear divergence at the moment, but the convergence of MACD and Signal line requires monitoring.

Volume Analysis

There are noticeable spikes in volume accompanying price increases, validating the bullish moves seen earlier.

Recently, volume seems to be tapering off, which may indicate weakening buying interest or a short-term consolidation.

Rising prices with decreasing volume often suggests a potential reversal or pullback.

Support & Resistance

Support: Around 3520, where a previous breakout took place, now acts as a support level.

Resistance: Current level around 3680 acts as potential resistance.

A confirmed breach of the 3680 level with strong volume could pave the way for further upside, while failing to break higher might lead to retesting the 3520 zone.

Actionable Insights

Consider buying on a confirmed breakout above 3680 with strong volume.

If bullish momentum wanes without a breakout, consider short-term selling due to the resistance at 3680.

Traders could hold existing long positions until a clear signal emerges.

The AI Technical Analysis Center is an informational tool only and does not constitute investment or trading advice.
This site is registered on wpml.org as a development site. Switch to a production site key to remove this banner.