Generic selectors
Exact matches only
Search in title
Search in content
Post Type Selectors

Popular stocks

Crypto

CFD

Currencies

Support

Gold

GOLD – Technical Analysis – 4h

March 5, 2026 17:03

Quick Summary

The gold Futures chart shows a bearish trend continuing after a previous high near 5400. Prices are now around 5087, indicating sustained downward momentum.

Technical indicators such as the MACD and high trading volumes support this bearish outlook, with critical levels around 5000 and 5300.

Candlestick Analysis

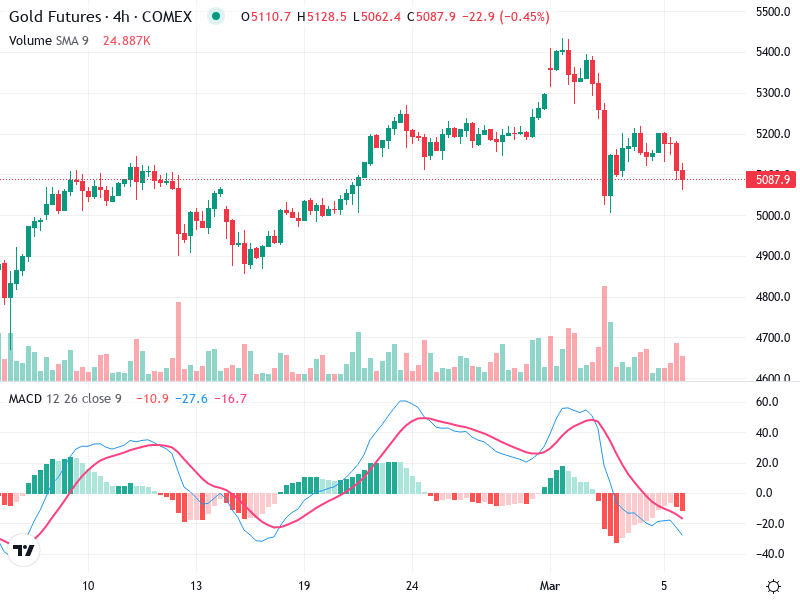
The overall trend appears to be bearish, with prices declining from a peak near 5400 to around the 5087 mark.

No distinct bullish reversal patterns like hammers or bullish engulfing have been observed at the current level, suggesting the downtrend might continue.

A breakout zone was breached as the price fell from 5300, turning resistance to support around 5100.

MACD Analysis

Recently, the MACD line crossed below the Signal line, indicating a bearish outlook. This crossover suggests increasing bearish momentum.

The MACD histogram is negative and widening, pointing to strengthening bearish momentum.

No clear divergence is visible between the MACD and price action that would suggest a potential reversal.

Volume Analysis

There was a noticeable increase in volume during the recent price decline, which supports the bearish breakout from the previous support level.

The spike in volume suggests possible institutional selling, further confirming the bearish sentiment.

The increased volume during price decline reinforces the bearish market sentiment.

Support & Resistance

Key support levels lie around 5000, which is a psychological level and might provide some buying interest.

Resistance is significant around 5300, where prices started the current downtrend.

If price rebounds, this level will be crucial to watch for a reversal or continuation.

Actionable Insights

Traders could consider selling if there’s a confirmed break below 5000 with high volume, targeting lower support levels.

For long-term positions, holding with a stop-loss below 5000 might be prudent, waiting for reversal signals.

Monitor for any bullish candlestick patterns or positive MACD divergence near support levels for potential buying opportunities.

The AI Technical Analysis Center is an informational tool only and does not constitute investment or trading advice.
This site is registered on wpml.org as a development site. Switch to a production site key to remove this banner.