Generic selectors
Exact matches only
Search in title
Search in content
Post Type Selectors

Popular stocks

Crypto

CFD

Currencies

Support

Gold

GOLD – Technical Analysis – 4h

March 6, 2026 17:02

Quick Summary

The gold Futures 4h chart shows mixed signals with recent bearish movements followed by a slight bullish recovery. Candlestick patterns and technical indicators suggest cautious optimism for a potential reversal.

Key support and resistance levels are crucial in determining future price action, with traders advised to monitor these closely.

Candlestick Analysis

The overall trend appears to be sideways with recent bearish movements followed by a slight bullish recovery.

A potential bullish reversal is indicated by the hammer pattern around March 5th, signaling possible support.

Prior to this, there was a bearish engulfing pattern that led to a downtrend.

MACD Analysis

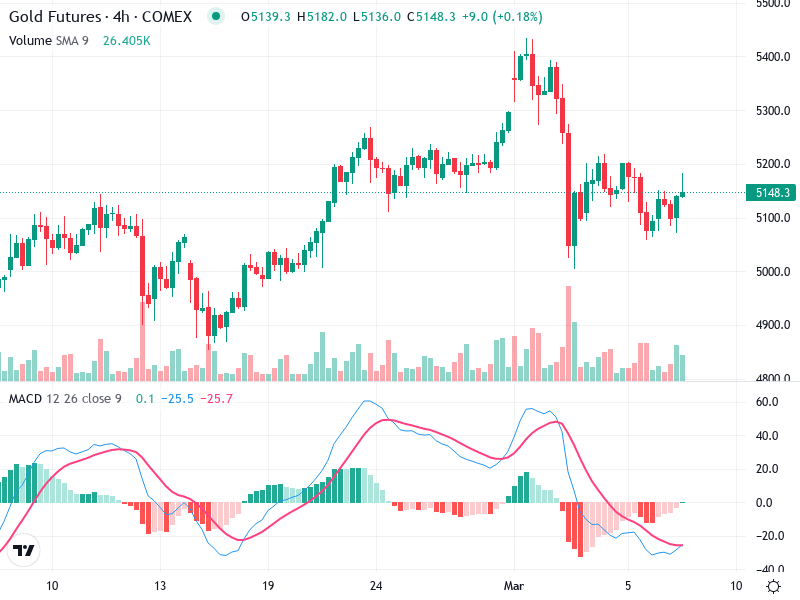
Currently, the MACD line is below the signal line, indicating bearish momentum, but it’s starting to converge, hinting at a potential bullish crossover.

The histogram shows diminishing bearish momentum, supporting the potential for a bullish crossover.

No clear divergence with price action noted at this stage.

Volume Analysis

Increased volume during the recent downturn suggests strong selling pressure, potentially from institutional traders.

A slight uptick in volume coincides with the recent minor recovery, which needs to be watched for confirmation.

Volume supporting price movements indicates that recent selling pressure was substantial.

Support & Resistance

Key support is observed around 5100. A drop below this could signal further declines.

Resistance is noted around 5220. A break above this level, with volume confirmation, may indicate further upside.

Monitoring these levels is essential for potential buy or sell opportunities.

Actionable Insights

Consider entering a long position if the price breaks and closes above 5220 with significant volume and MACD confirms a bullish crossover.

A drop below the 5100 support level with increased volume could be an opportunity for short positions.

Until clear confirmation of directionality is achieved, a hold strategy may be wise.

The AI Technical Analysis Center is an informational tool only and does not constitute investment or trading advice.
This site is registered on wpml.org as a development site. Switch to a production site key to remove this banner.