Generic selectors
Exact matches only
Search in title
Search in content
Post Type Selectors

Popular stocks

Crypto

CFD

Currencies

Support

Gold

GOLD – Technical Analysis – 4h

March 9, 2026 17:02

Quick Summary

The 4h chart analysis for gold Futures reveals crucial technical insights.

gold has shown a sharp decline followed by consolidation.

Current market sentiment leans towards neutral to bearish.

Candlestick Analysis

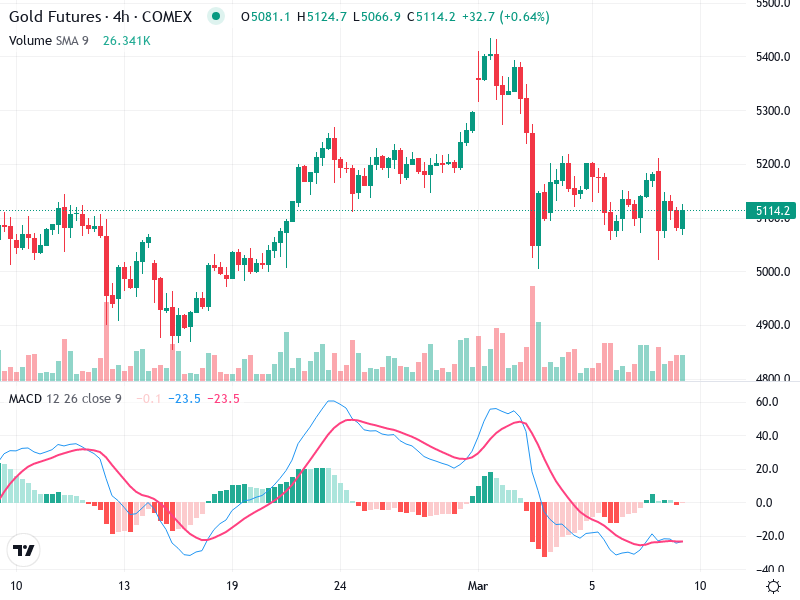
The chart displays a recent downturn from 5400, followed by a sideways consolidation around the 5110 level.

There are several smaller, indecisive candlesticks indicative of market uncertainty, such as doji patterns.

The recent peak around 5400 serves as a resistance zone, with the 5000 level acting as a support.

MACD Analysis

The MACD line is below the Signal line, suggesting bearish momentum.

No recent bullish crossover observed, maintaining the bearish stance.

No significant divergence between MACD and price action, aligning with the current consolidation phase.

Volume Analysis

Volume peaks align with price declines, suggesting selling pressure at high volumes near 5400.

The decrease in volume during sideways movement suggests lack of strong buying interest.

Volume spikes seen during the price drop suggest potential institutional selling.

Support & Resistance

Around 5400, the previous peak is a key resistance.

Approximately 5000, serving as a crucial support line seen multiple times.

The recent price action emphasizes these levels as pivotal for future movements.

Actionable Insights

If price approaches resistance at 5400 with no strong buying signals, consider selling or shorting.

Consider buying if a movement with volume breaks above 5400.

In the short term, holding may be advisable due to sideways trend and low momentum.

The AI Technical Analysis Center is an informational tool only and does not constitute investment or trading advice.
This site is registered on wpml.org as a development site. Switch to a production site key to remove this banner.