Generic selectors
Exact matches only
Search in title
Search in content
Post Type Selectors

Popular stocks

Crypto

CFD

Currencies

Support

Gold

GOLD – Technical Analysis – 4h

March 11, 2026 17:02

Quick Summary

The gold Futures chart shows a mixed trend with recent consolidation. The asset experienced a bullish run peaking at around 5400, followed by a decline. Key resistance is observed around 5300-5400.

Breakouts above these resistance levels could lead to continued bullish movements.

Candlestick Analysis

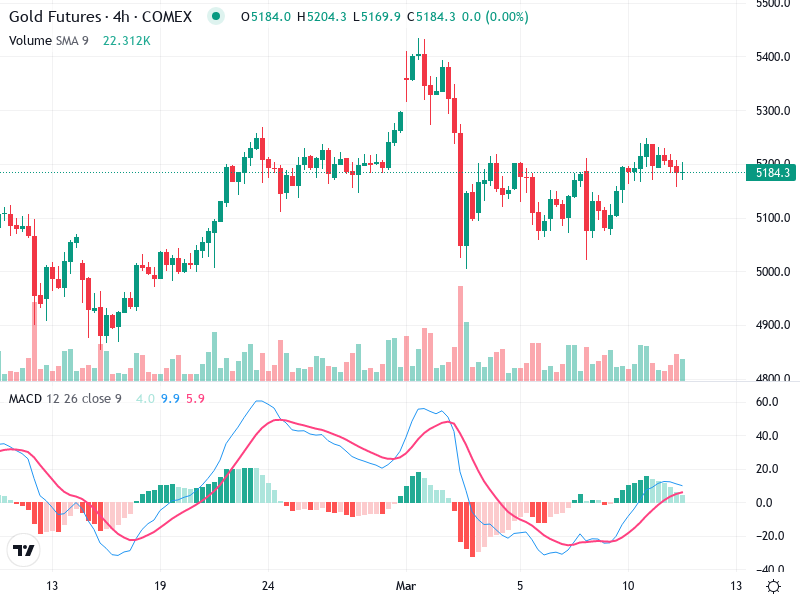
Recently, there's no clear formation of major candlestick patterns like engulfing or doji. However, there have been smaller formations suggesting partial reversals, such as short consolidation phases.

The overall trend appears mixed, with recent sideways action. There was a prior bullish run peaking around 5400, followed by a decline and subsequent consolidation.

A breakout above 5300 could signal resumed bullish momentum, while a pullback below 5100 may indicate further bearish potential.

MACD Analysis

The MACD line is slightly above the Signal line, suggesting a recent bullish crossover, which indicates potential upward momentum.

Positive bars on the histogram indicate current bullish momentum, though their height is diminishing, signaling a possible reduction in buying pressure.

No strong divergences between MACD movements and price action are evident, suggesting momentum and price are relatively aligned.

Volume Analysis

There was a noticeable increase in volume during the previous upward spike, suggesting initial strong buying interest, which has since declined.

Current lower volume does not strongly support the sideways price movement, indicating caution in placing large bets on trend continuation.

Notable volume spikes correlate with both previous upward and downward movements, suggesting active institutional involvement during those periods.

Support & Resistance

Support is around 5100; if breached, could lead to further declines.

Resistance is between 5300-5400; a breakout above this zone may catalyze further bullish movement.

These levels are crucial for determining entry and exit points. Traders should watch these zones for signs of reversals or continuations.

Actionable Insights

Consider entry if price breaks above 5300 with increased volume, confirming a potential continuation of the bullish trend.

If the price falls below 5100, it might trigger further declines, suggesting a short position could be profitable.

In the absence of volume confirmation after current sideways movement, waiting for clearer signals might be prudent.

The AI Technical Analysis Center is an informational tool only and does not constitute investment or trading advice.
This site is registered on wpml.org as a development site. Switch to a production site key to remove this banner.