Generic selectors
Exact matches only
Search in title
Search in content
Post Type Selectors

Popular stocks

Crypto

CFD

Currencies

Support

Gold

GOLD – Technical Analysis – 4h

September 10, 2025 07:13

Quick Summary

The gold Futures 4-hour chart presents a bullish outlook. Recently, there’s been a steady upward trend characterized by higher highs and higher lows.

However, the recent consolidation phase necessitates cautious observation for potential breakout movements.

Candlestick Analysis

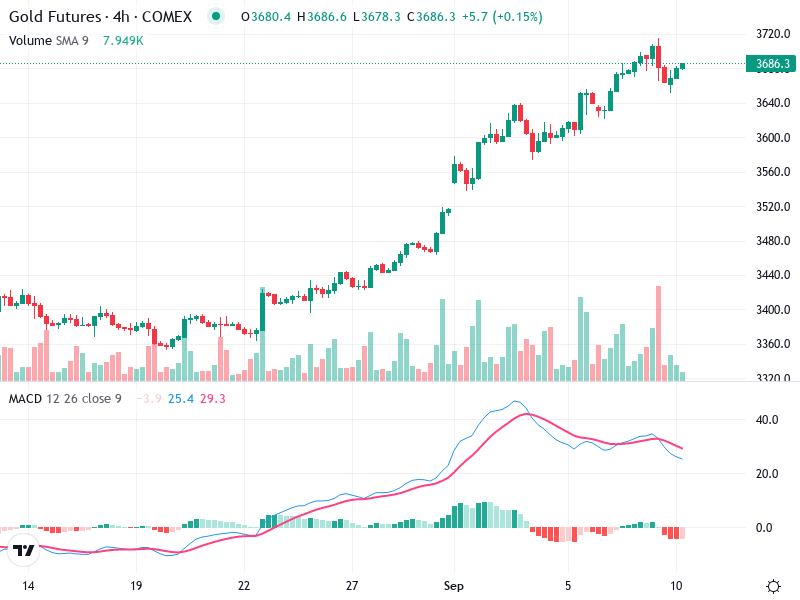
Recently, there's a series of smaller-bodied candles with wicks suggesting indecision, potentially indicating a pause or minor retracement in the uptrend.

The trend is clearly bullish, characterized by higher highs and higher lows.

The area around 3680 appears to be a consolidation zone after a strong upward move, suggesting a potential breakout or further consolidation.

MACD Analysis

The MACD line is slightly above the Signal line but appears to be converging, which might suggest weakening momentum.

The histogram is showing decreasing positive values, indicating a potential loss of bullish momentum.

There is no clear divergence between MACD and price action; however, the slowing momentum suggests caution.

Volume Analysis

Volume appears to be decreasing as the price consolidates, which is typical during consolidation phases.

The decrease in volume during this consolidation phase suggests a lack of strong selling pressure.

No significant spikes indicating heavy institutional activity, but overall consistent with the uptrend.

Support & Resistance

Key support around 3640, evident from previous price action pullbacks.

Key resistance near 3700, which aligns with the most recent peak before consolidation.

Key to watch how the price behaves at these levels for potential reversal or continuation.

Actionable Insights

Consider buying on a confirmed breakout above 3700 with strong volume or on a pullback to the 3640 support zone if it holds.

Watch for a bearish pattern or volume increase if the price breaks below 3640.

For those already in positions, hold and watch volume and MACD for signs of renewed momentum or reversal.

The AI Technical Analysis Center is an informational tool only and does not constitute investment or trading advice.
This site is registered on wpml.org as a development site. Switch to a production site key to remove this banner.