September 25, 2025 16:03
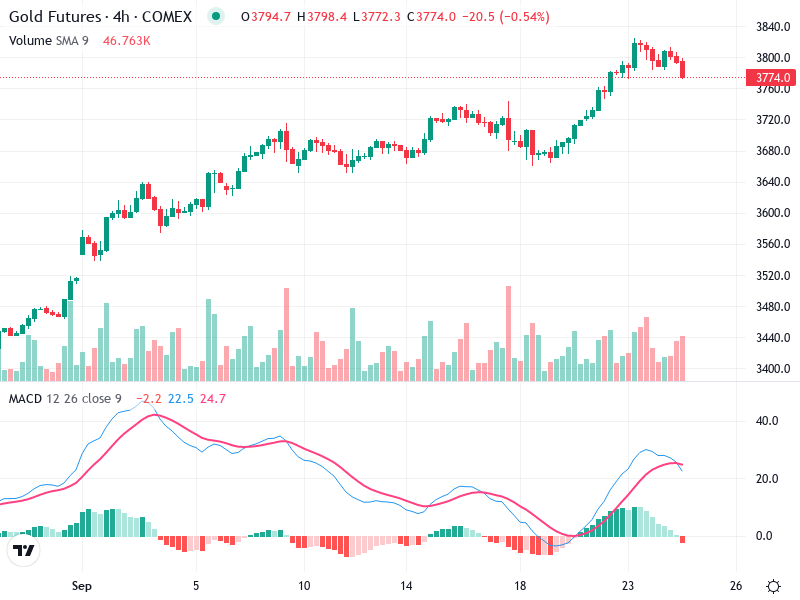
The gold Futures chart depicts a shift in the market sentiment with recent bearish signals. Price action has transitioned from an uptrend to a downtrend, accompanied by technical indicators.
This analysis provides insights into future price movements by examining key chart components such as MACD and volume changes.
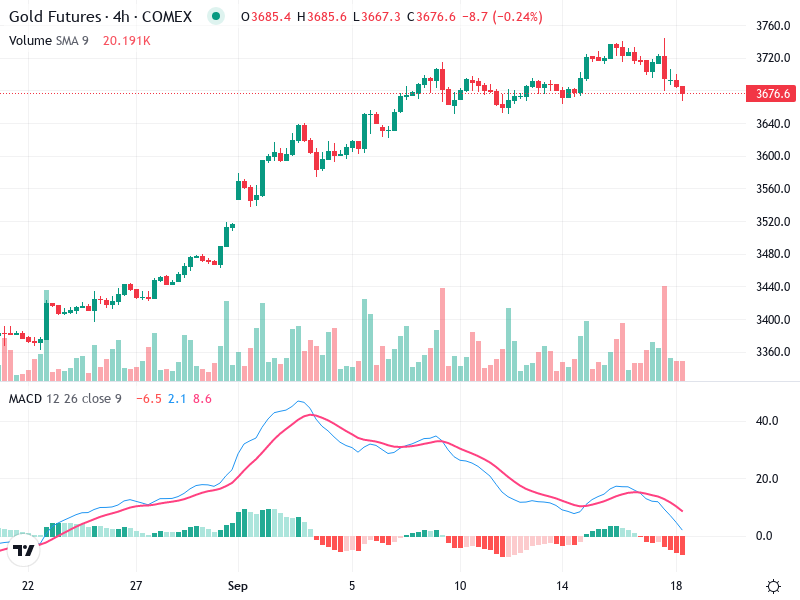
The chart shows an uptrend from late August to early September, but recent patterns indicate a bearish reversal.
No strong reversal candlestick patterns like a bullish engulfing or hammer are evident.
The recent larger red candles suggest bearish sentiment, reinforced by failed attempts to break resistance.
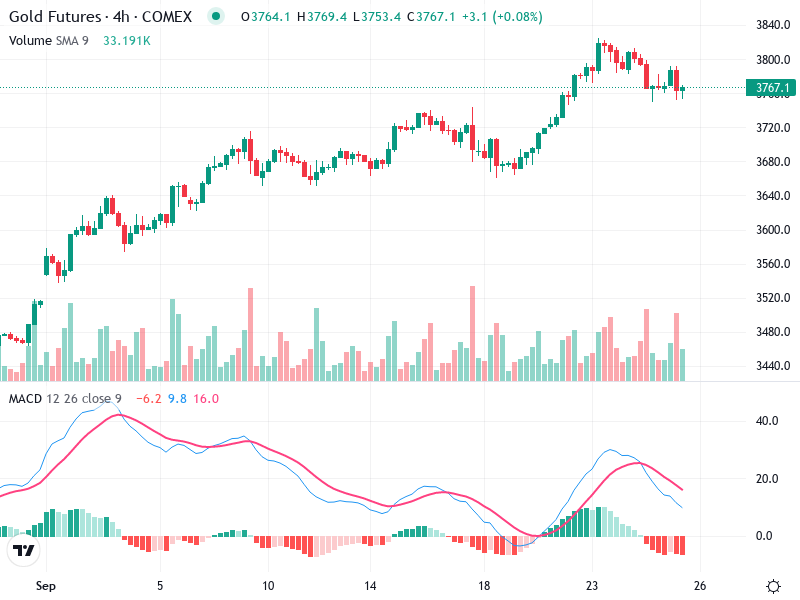
The MACD line crossing below the Signal line indicates a bearish crossover.
The MACD histogram is negative and expanding, highlighting increasing bearish momentum.
No significant divergence between MACD and price, with both moving downward.
A notable increase in volume during the recent decline confirms the bearish move.
Higher volume on downward moves supports the bearish sentiment.
Heightened volume spikes suggest possible institutional selling or increased volatility.
The 3685 level, recently a support, now acts as resistance.
A key support is visible around the 3600 level, critical for future price action.
Monitor these levels for potential breakout or reversal signals.
Considering the bearish crossover and volume confirmation, a cautious trading approach is advised.
Traders may consider selling on rallies near resistance levels or entering short positions.
A bounce back above 3685 could invalidate bearish scenarios, so watch for lighter volume on rallies.