Generic selectors
Exact matches only
Search in title
Search in content
Post Type Selectors

Popular stocks

Crypto

CFD

Currencies

Support

Gold

GOLD – Technical Analysis – 4h

September 24, 2025 16:03

Quick Summary

The gold Futures chart showcases a recent upward trend with a noticeable pullback. Current price movements indicate a potential consolidation around key support levels. Key technical indicators such as MACD and volume trends hint at possible future movements.

Candlestick Analysis

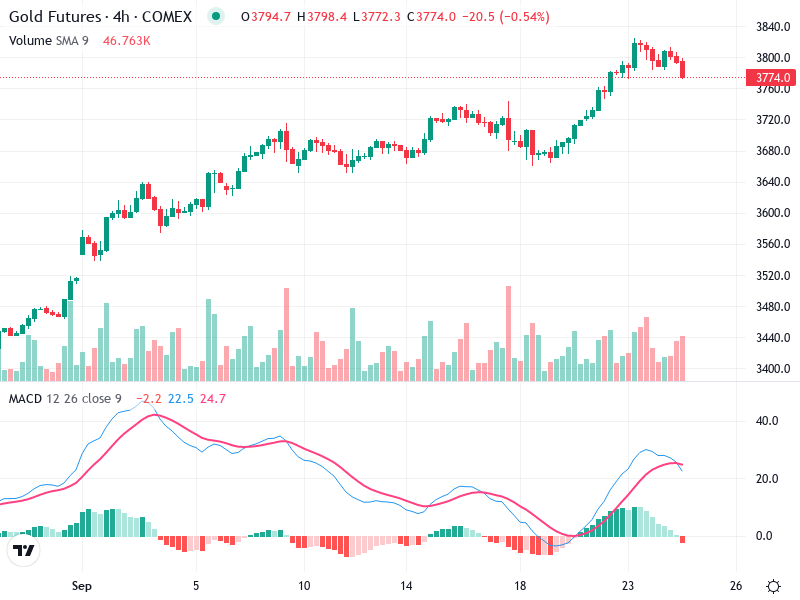
The recent candlesticks indicate a potential pullback. Notice the formation of small-bodied red candles after a period of strong bullish activity; this could suggest indecision or a potential reversal.

The overall trend appears bullish, with a series of higher highs and higher lows. However, there is a minor pullback as the market pauses.

There was a breakout above the 3770 level, and now prices are pulling back to this zone, indicating it may serve as a support level.

MACD Analysis

The MACD line is above the Signal line but is closing in, indicating a weakening bullish momentum.

The histogram has been decreasing, signifying a weakening momentum, with the potential for a bearish crossover if the trend continues.

There does not appear to be any significant divergence between the MACD and price action currently.

Volume Analysis

Volume has been diminishing as prices retreated, which might suggest that the selling pressure is not very strong.

The initial rise was accompanied by higher volume, supporting the breakout. The current drop in volume suggests a possible lack of conviction in the pullback.

No significant spikes indicating institutional activity during the pullback phase.

Support & Resistance

The price is approaching a potential support at the previous breakout level around 3770.

Resistance can be eyed near the recent highs around 3800.

The confirmation of support at 3770 will be key for near-term movements.

Actionable Insights

Consider buying if the price consolidates at the support level and shows signs of strength (e.g., bullish candlestick formation or MACD bullish crossover).

Selling might be considered if the price breaks below the 3770 level with increased volume.

Given the current pullback, a hold approach might be best until clearer confirmation of trend direction is available.

The AI Technical Analysis Center is an informational tool only and does not constitute investment or trading advice.
This site is registered on wpml.org as a development site. Switch to a production site key to remove this banner.