Generic selectors
Exact matches only
Search in title
Search in content
Post Type Selectors

Popular stocks

Crypto

CFD

Currencies

Support

Gold

GOLD – Technical Analysis – 4h

September 29, 2025 16:02

Quick Summary

The chart shows a prominent upward trend driven by bullish candlesticks and increasing volume.

demonstrates positive momentum supported by technical indicators.

Overall, the asset displays potential for further gains, subject to key resistance levels.

Candlestick Analysis

There are several bullish candlesticks indicating strong upward momentum, with some pullbacks represented by smaller bearish candles.

The overall trend is bullish, with a series of higher highs and higher lows indicating sustained upward momentum.

The recent breakout above 3840 suggests strong bullish sentiment. Minor pullbacks are evident but quickly followed by upward continuation.

MACD Analysis

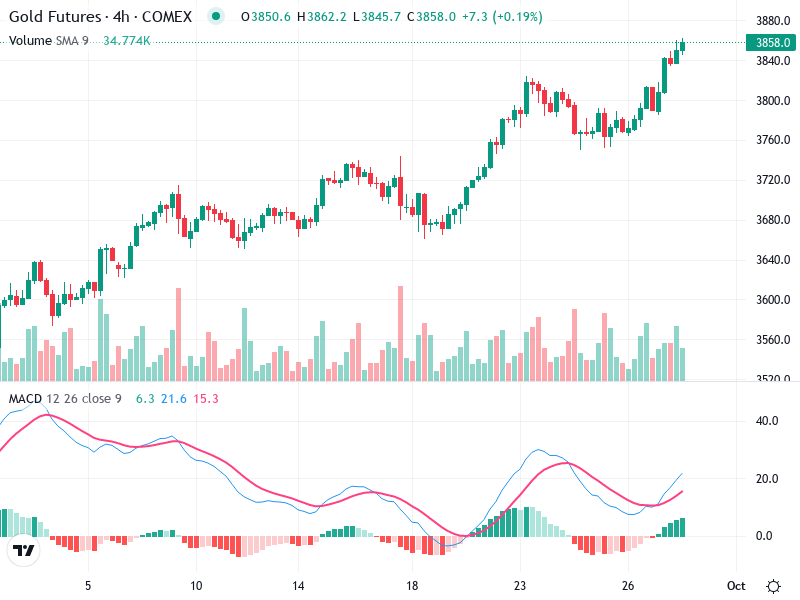
The MACD line is above the Signal line, showing a bullish crossover that indicates increasing bullish momentum.

The histogram is expanding in the positive territory, reaffirming the bullish momentum.

No significant divergences between the MACD and the price action are observed, suggesting that the current trend is well-supported by momentum.

Volume Analysis

There are several peaks in volume corresponding to the bullish candles, supporting the upward price movement.

Volume increases on bullish days affirm the strength of the breakout, suggesting institutional buying might be involved.

A noticeable volume spike is seen at the points of price surge, indicating robust buying interest.

Support & Resistance

Previous resistance around 3840 could now act as a support level in the event of a pullback.

Immediate resistance may be experienced near the 3862 level, which is the high of the current period.

Actionable Insights

Consider buying on minor pullbacks while maintaining an eye on the 3840 support as a stop-loss region.

Traders could consider partial profit-taking near resistance levels at 3862, looking for overbought signals.

Holding can be considered while monitoring for a reversal signal, especially if volume decreases as prices continue to rise.

The AI Technical Analysis Center is an informational tool only and does not constitute investment or trading advice.
This site is registered on wpml.org as a development site. Switch to a production site key to remove this banner.