Generic selectors
Exact matches only
Search in title
Search in content
Post Type Selectors

Popular stocks

Crypto

CFD

Currencies

Support

Gold

GOLD – Technical Analysis – 4h

October 6, 2025 16:03

Quick Summary

The gold Futures 4-hour chart shows a solid uptrend.

The recent market action indicates a continuation of the bullish momentum.

Investors are optimistic about further gains.

Candlestick Analysis

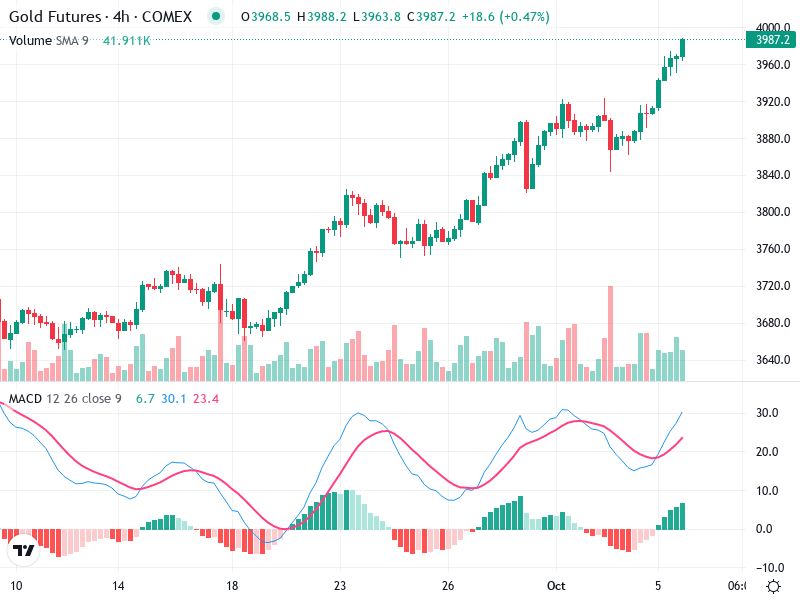
The overall trend is bullish, evidenced by a series of higher highs and higher lows.

Several consecutive bullish candles with strong closes suggest sustained buying pressure.

The price recently broke above the range around 3920, indicating a potential continuation of the uptrend.

MACD Analysis

The MACD line is above the Signal line, indicating bullish momentum.

The positive MACD histogram suggests growing bullish momentum without clear divergences.

This pattern supports the strength of the current trend.

Volume Analysis

A noticeable increase in volume supports the bullish trend.

Significant volume spikes accompanied the recent breakout, implying possible institutional buying.

This action hints at strong retail interest as well.

Support & Resistance

Immediate support is around the 3920 level, which was previous resistance.

Resistance is at the 4000 level, which could be psychological resistance.

The price needs to maintain support to confirm the uptrend.

Actionable Insights

Traders might consider buying on pullbacks near 3920 or confirmation above 4000.

Cautious traders should watch for reversal signs near the 4000 resistance.

Existing long positions could be held with a stop-loss just below 3920.

The AI Technical Analysis Center is an informational tool only and does not constitute investment or trading advice.
This site is registered on wpml.org as a development site. Switch to a production site key to remove this banner.