Generic selectors
Exact matches only
Search in title
Search in content
Post Type Selectors

Popular stocks

Crypto

CFD

Currencies

Support

Gold

GOLD – Technical Analysis – 4h

October 8, 2025 16:03

Quick Summary

The chart shows a strong upward trend with persistent buying interest. Recent price action indicates a robust bullish sentiment.

Noticeable volume increases at key points validate the ongoing trend, making it a compelling scenario for further rises.

Candlestick Analysis

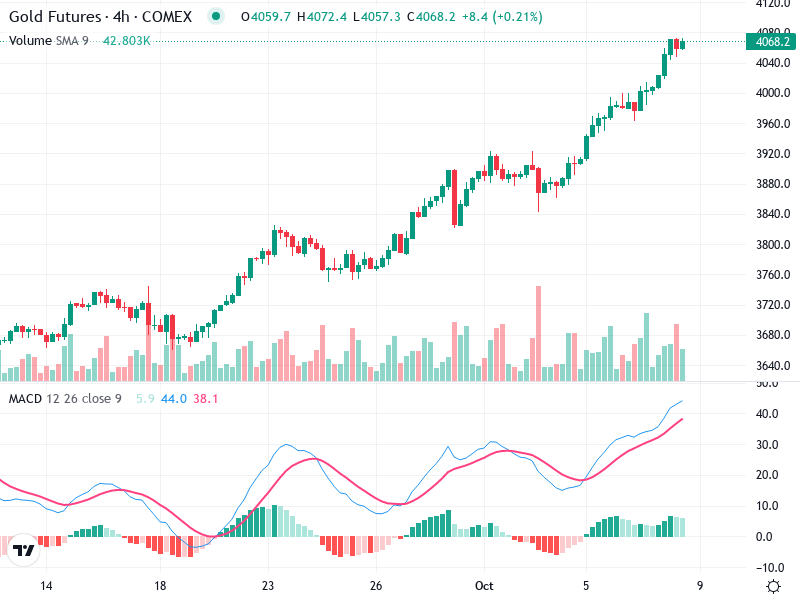
The chart exhibits a strong bullish trend with higher highs and higher lows, indicating consistent upward movement and solid market interest.

No major reversal patterns are visible, and candlesticks show bullish characteristics with the absence of significant upper shadows, suggesting continued momentum.

A noticeable breakout occurred around the 3960 area, indicating strong buying pressure.

MACD Analysis

The MACD line is positioned well above the Signal line, indicating a bullish crossover and suggesting strong upward momentum.

The MACD histogram is positive and expanding, reflecting increasing bullish momentum, typically indicating sustained upward movement.

No divergences are visible between the MACD and price action, supporting the bullish continuation.

Volume Analysis

There is a notable uptick in volume during key upward movements, especially around breakout points, supporting price increases.

Occasional volume spikes suggest potential institutional activity, particularly during breakout and push phases, validating price movement.

Support & Resistance

Key support is evident around the 3960 level, where the price last consolidated before breaking out.

Minor resistance appears around current levels, as observed from recent small pullbacks, suggesting room for further upside.

Actionable Insights

Consider a buy strategy on pullbacks to the support level around 3960 to capitalize on continued bullish momentum.

Monitor for key confirmation signals such as continuous high volume and sustained MACD bullishness.

Be cautious of sudden reversal candlestick patterns or MACD crossovers signaling momentum loss.

The AI Technical Analysis Center is an informational tool only and does not constitute investment or trading advice.
This site is registered on wpml.org as a development site. Switch to a production site key to remove this banner.