Generic selectors
Exact matches only
Search in title
Search in content
Post Type Selectors

Popular stocks

Crypto

CFD

Currencies

Support

Gold

GOLD – Technical Analysis – 4h

October 9, 2025 16:02

Quick Summary

The chart of the asset shows key technical levels and patterns. The recent trends provide insights into potential future movements.

Observations on candlestick, MACD, and volume give a comprehensive view of the asset’s direction.

Candlestick Analysis

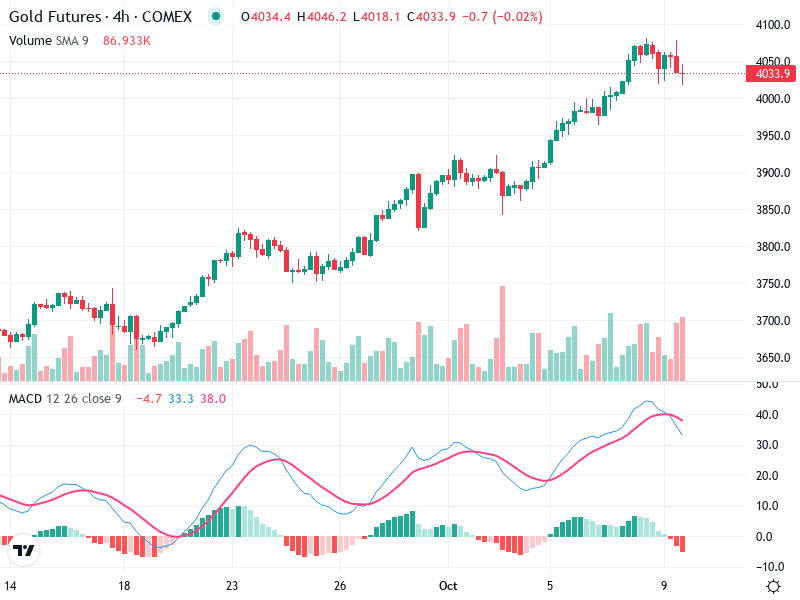
The chart shows a clear bullish trend over the observed period, with a series of higher highs and higher lows.

A recent bearish candlestick pattern is forming at the current level, suggesting potential downside risk if confirmed by subsequent price action.

The price made a recent high around 4050, with a pullback currently underway. Watch this level for a potential breakout or further rejection.

MACD Analysis

The MACD line has crossed below the Signal line, indicating a bearish crossover which can suggest a potential reversal or correction in the short term.

The histogram is moving into negative territory, suggesting declining momentum.

No clear divergence with the price action is detected at the moment.

Volume Analysis

Recent volume spikes coincide with price moves, confirming the strength of price movements. This increase in volume on recent up moves supports the bullish trend.

A notable drop in volume during the current pullback phase may suggest a lack of strong selling interest, which could imply temporary consolidation.

Support & Resistance

The recent high at 4050 acts as a key resistance level. A breakout above this could signal further bullish momentum.

There is a significant support level around 4000. Watch for potential buying interest to come in at this level if the price pulls back further.

Actionable Insights

Consider buying on a breakout above 4050 with strong volume, indicating continuation of the bullish trend.

Maintain long positions above the 4000 support level until a clear trend reversal is confirmed.

A break below 4000 with increasing volume could indicate a reversal, warranting cutting of long positions or initiating short positions.

The AI Technical Analysis Center is an informational tool only and does not constitute investment or trading advice.
This site is registered on wpml.org as a development site. Switch to a production site key to remove this banner.